Hi there BST,
I attach screenshots of some peculiarities that I've found looking at the 2D topography of resting-state PSD data.
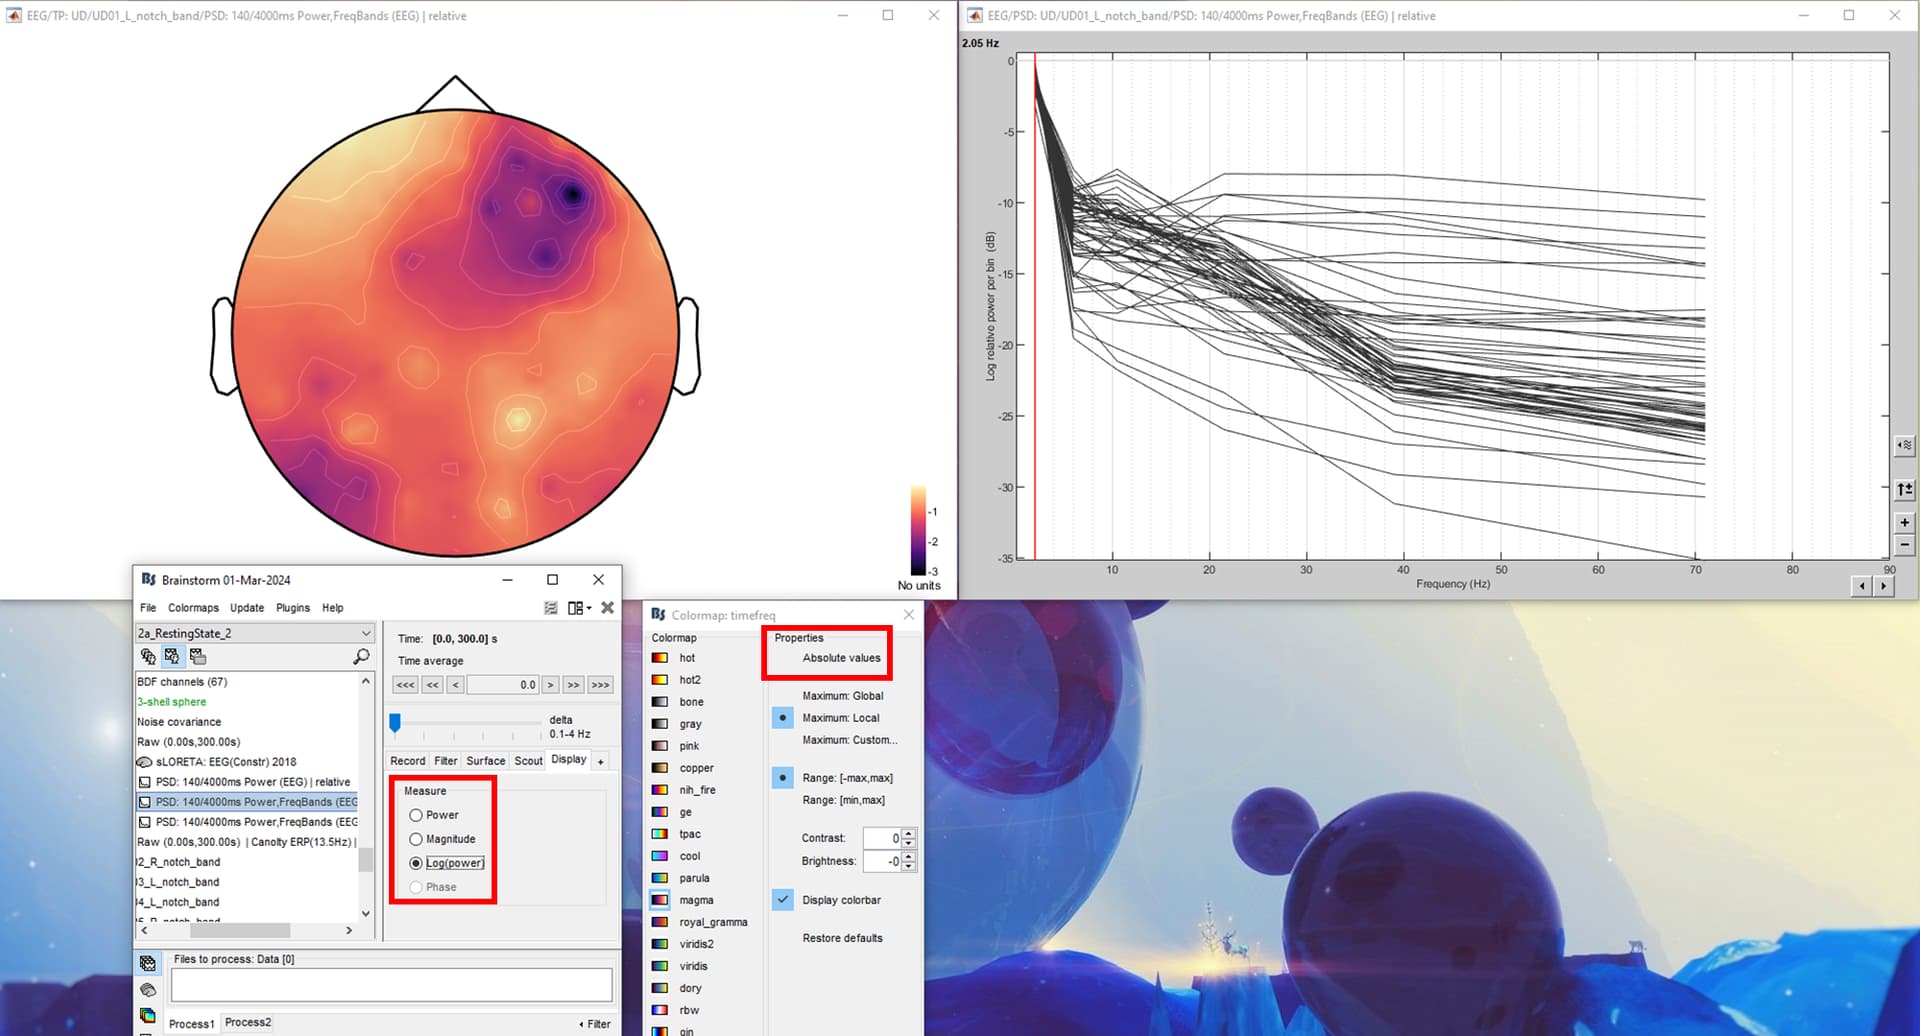
- The first thing that I noticed when I opened these 2D topograhy and its corresponding PSD was that the measure automatically defaulted to "Log(power)" and not "Power". Additionally under properties "absolute values" was not checked.
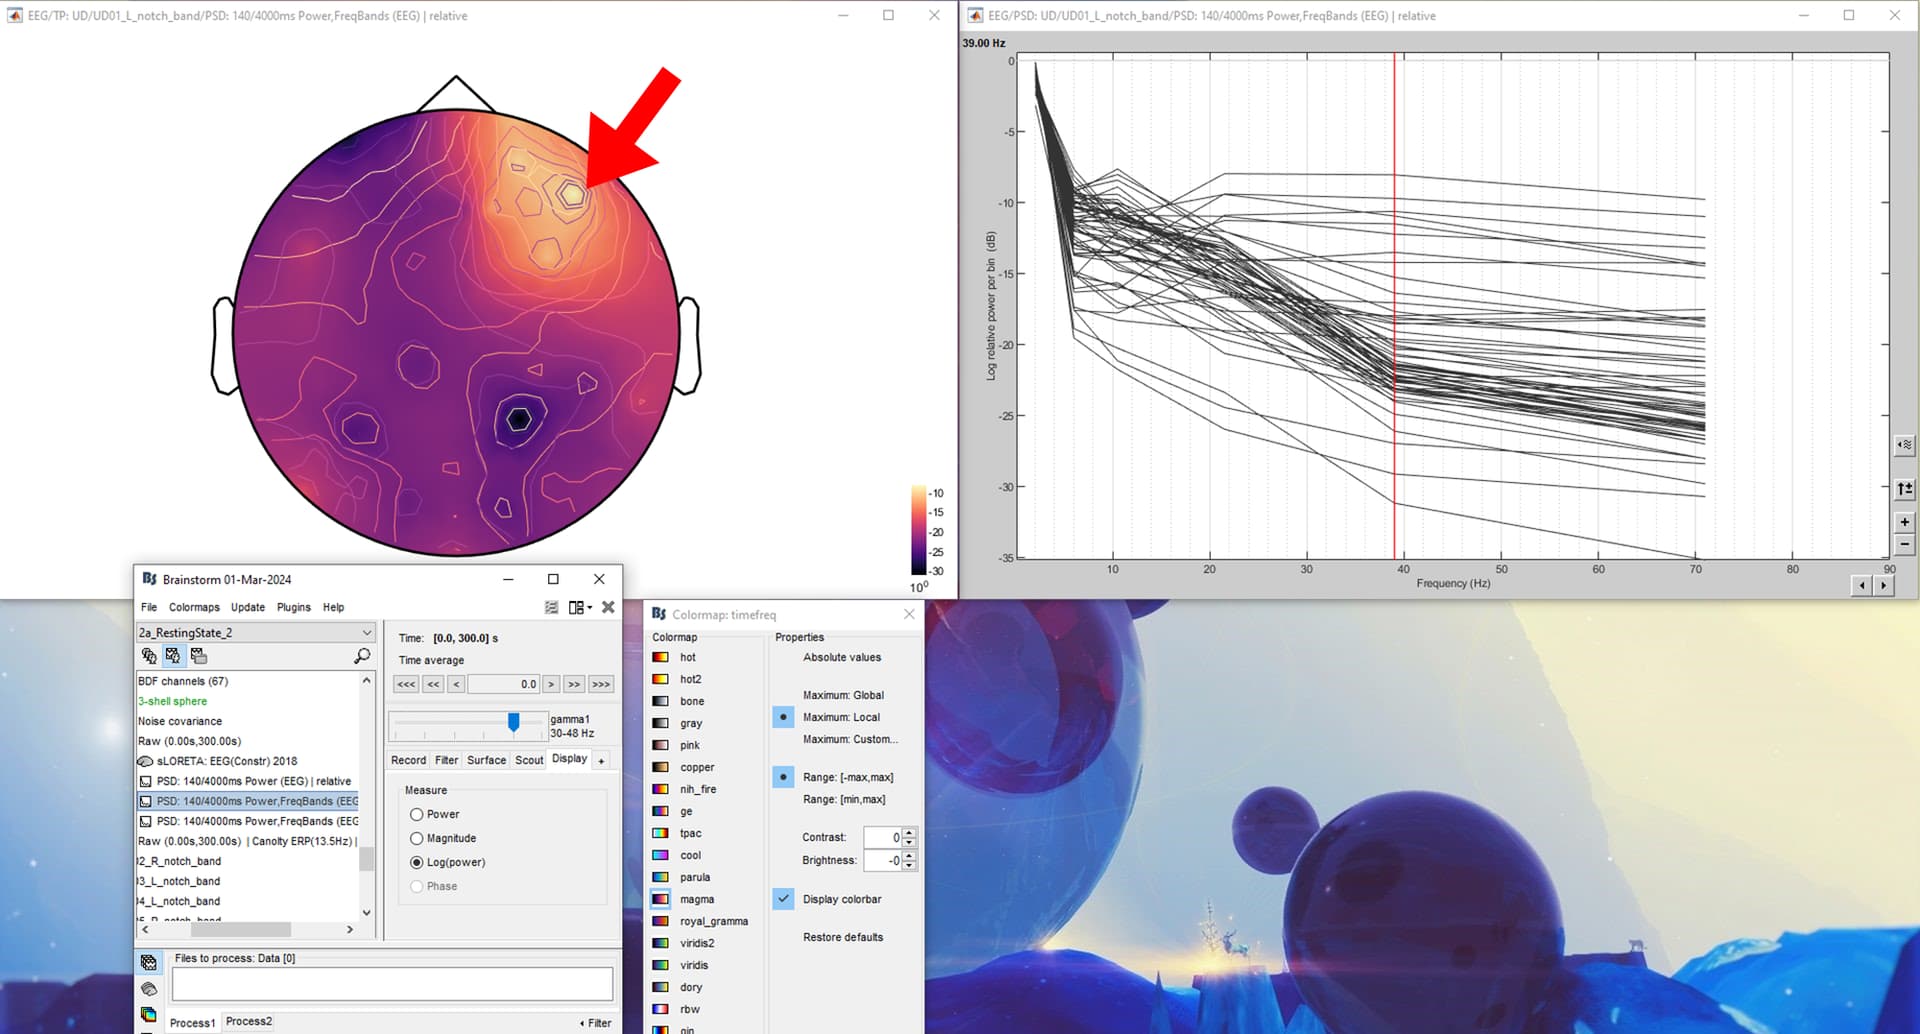
- I thought this was odd so I looked at the next frequency band, theta. The measure selected and the absolute value being unchecked was still the same. However if you look at the topography of theta you can see that there are TWO sets of topography contour lines that are overlapping. From inspection, it looks like the contour lines from the above screenshot (representing delta frequency band) is overlapping with the current contour lines representing theta.
- Similar thing happened to gamma1 frequency band. The contour lines representing delta band is overlapping with frequency band of gamma1.
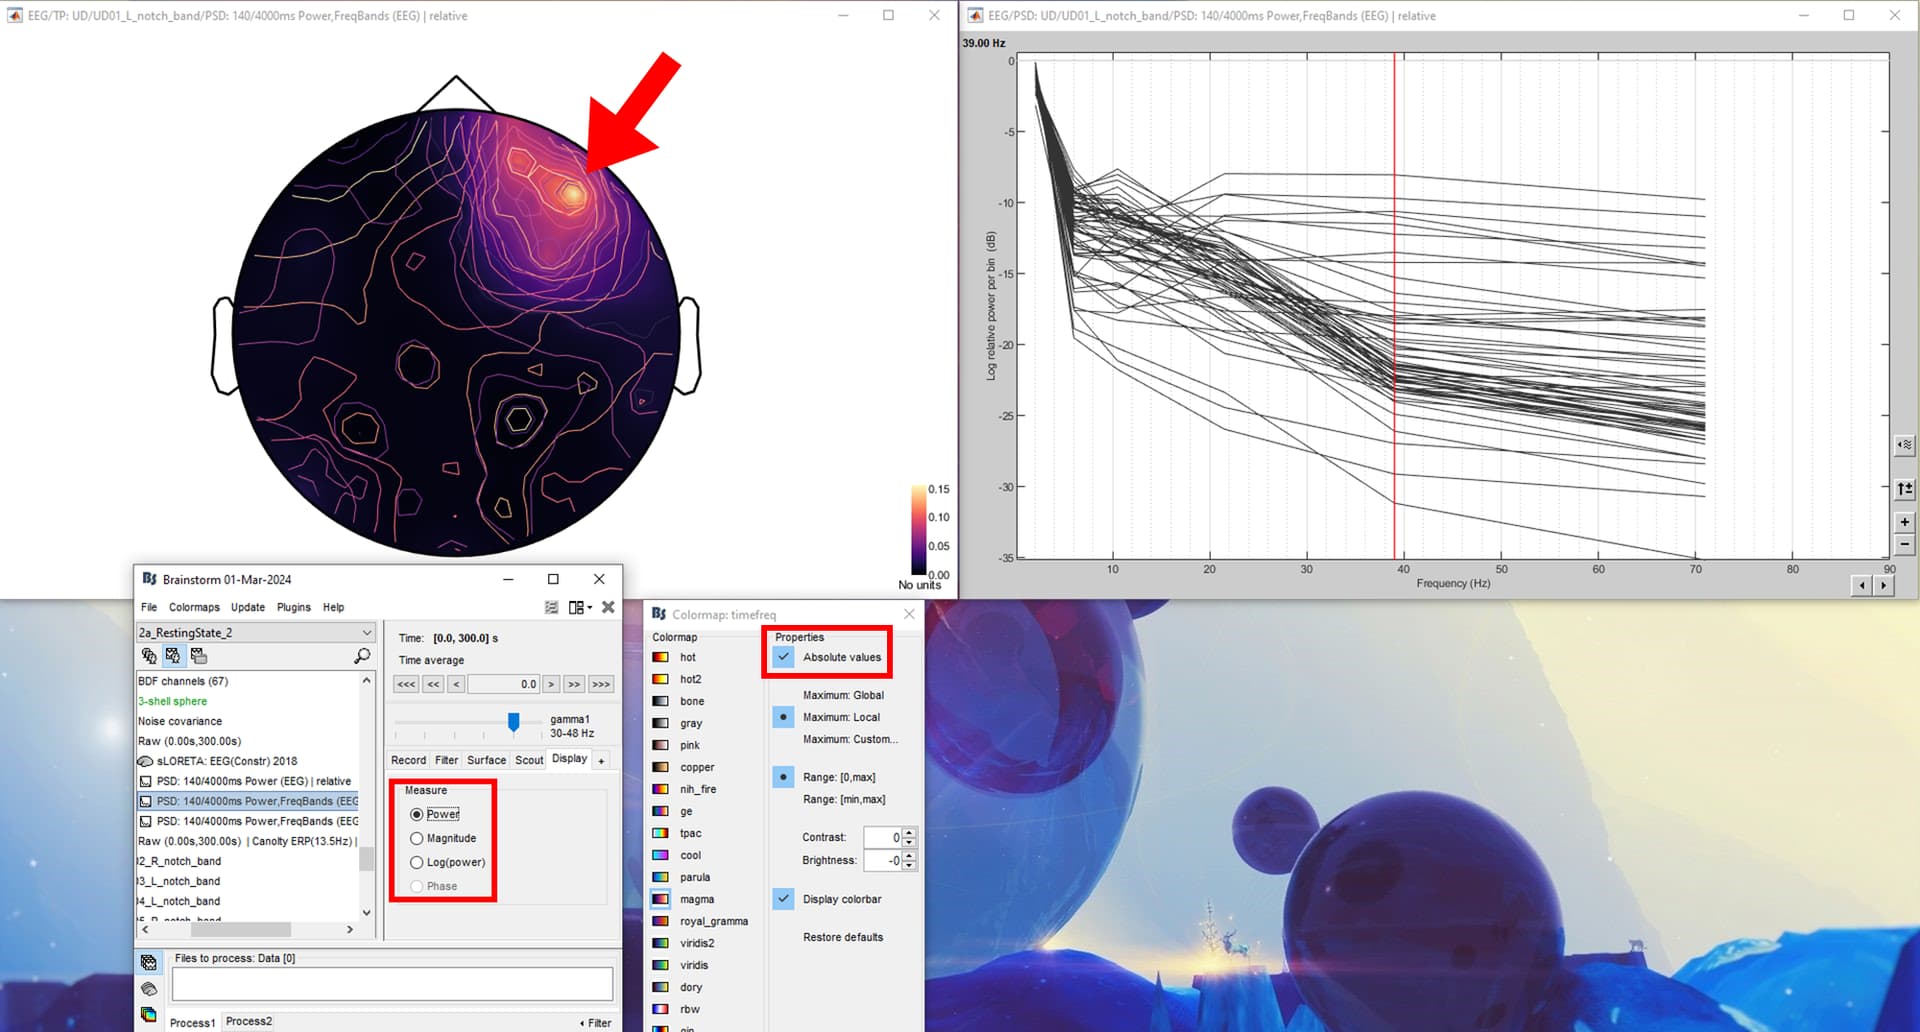
- Then I tried changing the measure that was being displayed at gamma1 frequency band. Interestingly once you change the measure from Log(power) to Power the absolute values is checked with it and the topography changes accordingly, clearly revealing the incorrect topography.

I believe these bugs are caused by the recent BST update that I did about 15 mins ago because before this update this did not happen.
What are your thoughts?