hello,
I'm doing statistical analysis (parametric test against baseline, student t) for MEG data, and have several questions about the scale on the right side of the statistical result.
1, Does the scale stand for statistic value? For the results of source (using scouts from atlas), the number in the table (display as table) also represent statistic value?
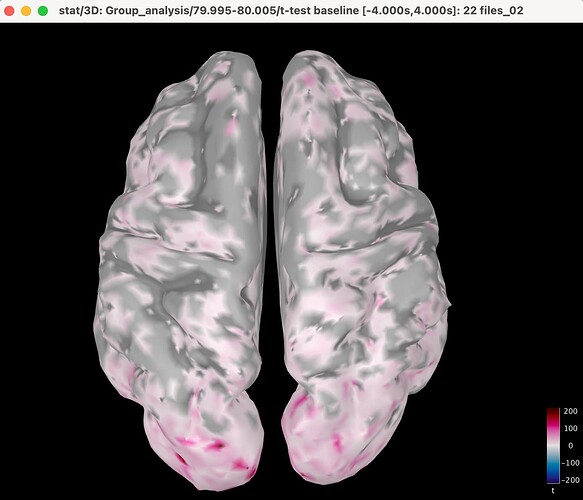
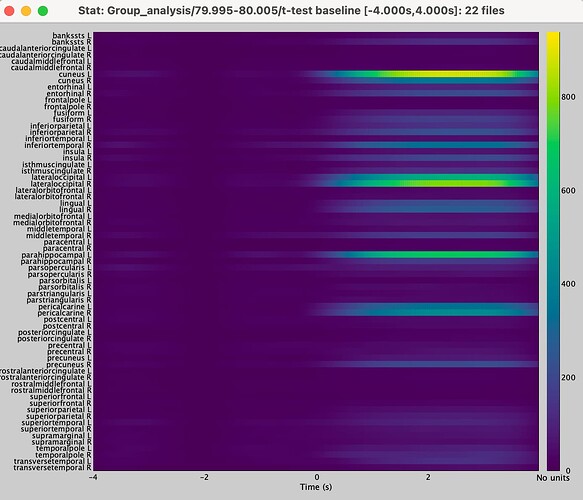
2, the scale of test for source (not using scout) and the scale of test for source (using scout): these two seems different.
[not using scout] has plus and minus value, like this
but [using scout] only has positive value.
What does this mean? Do plus and minus value represent the direction of activity, just as the Tutorial for Source Estimation? Or something else?
By the way, I followed this tutorial https://neuroimage.usc.edu/brainstorm/Tutorials/VisualGroup#Group_analysis:_Sources, and finished extracting absolute value before spatial smoothing and during spatial smoothing.
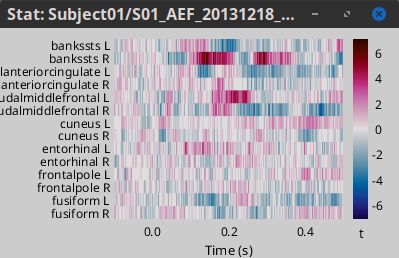
Please update your Brainstorm instance, now in case of plotting images from an statistics matrix  (as the one you get by using Scouts), the Colormap and Display units are set automatically.
- Yes all presented values are the statistic, in this case the t-statistic
- Keep in mind that these values are masked with the mask obtained by thresholding the p-value associated to the statistic with the Significance level α on the Stat tab. So the image will be updated when changing the Significance level.
- Same happens for the table. The values are masked.
In the shared image plot, it seems the Absolute values are selected for the colormap, uncheck the Absolute values option. Right-click on the colorbar. As stated above, if you update your Brainstorm instance, now the correct colorbar settings will be set according to the file.
Since you are comparing with the baseline, positive t-values mean higher source values than baseline.
Please, note that the comparison of the t-statistic computed with and without Scouts will not lead to the same results.
-
Without scouts: For a t-test is performed for each of the sources (vertices).
-
With scouts: First, the sources in one Scout are aggregated using the Scout function, then a t-test is performed with those aggregated values.
@Raymundo.Cassani Thank you for answering! Last I want to make sure that are the result show on the figures all the statistically significant results? How can I judge if the results are statistically significant or not?
Yes, these are values which associated p-values are smaller than the Significance level α that is set.
This will depend of your selected Significance level α. And the value of α is a decision that you should have to take before your analysis, based on your study, methods and the analyses to be performed.
In Brainstorm, we have a tutorial on Statistics. This is not a full statistics course, but it provides important concepts on statistics, and there are links towards relevant articles and posts at the end of the tutorial.
https://neuroimage.usc.edu/brainstorm/Tutorials/Statistics


