Hi Brainstorm team,
Thank you always for your work in making MEEG data analysis highly user-friendly for so many of us - really appreciate your work - I feel like this isn't stated that often so thank you!
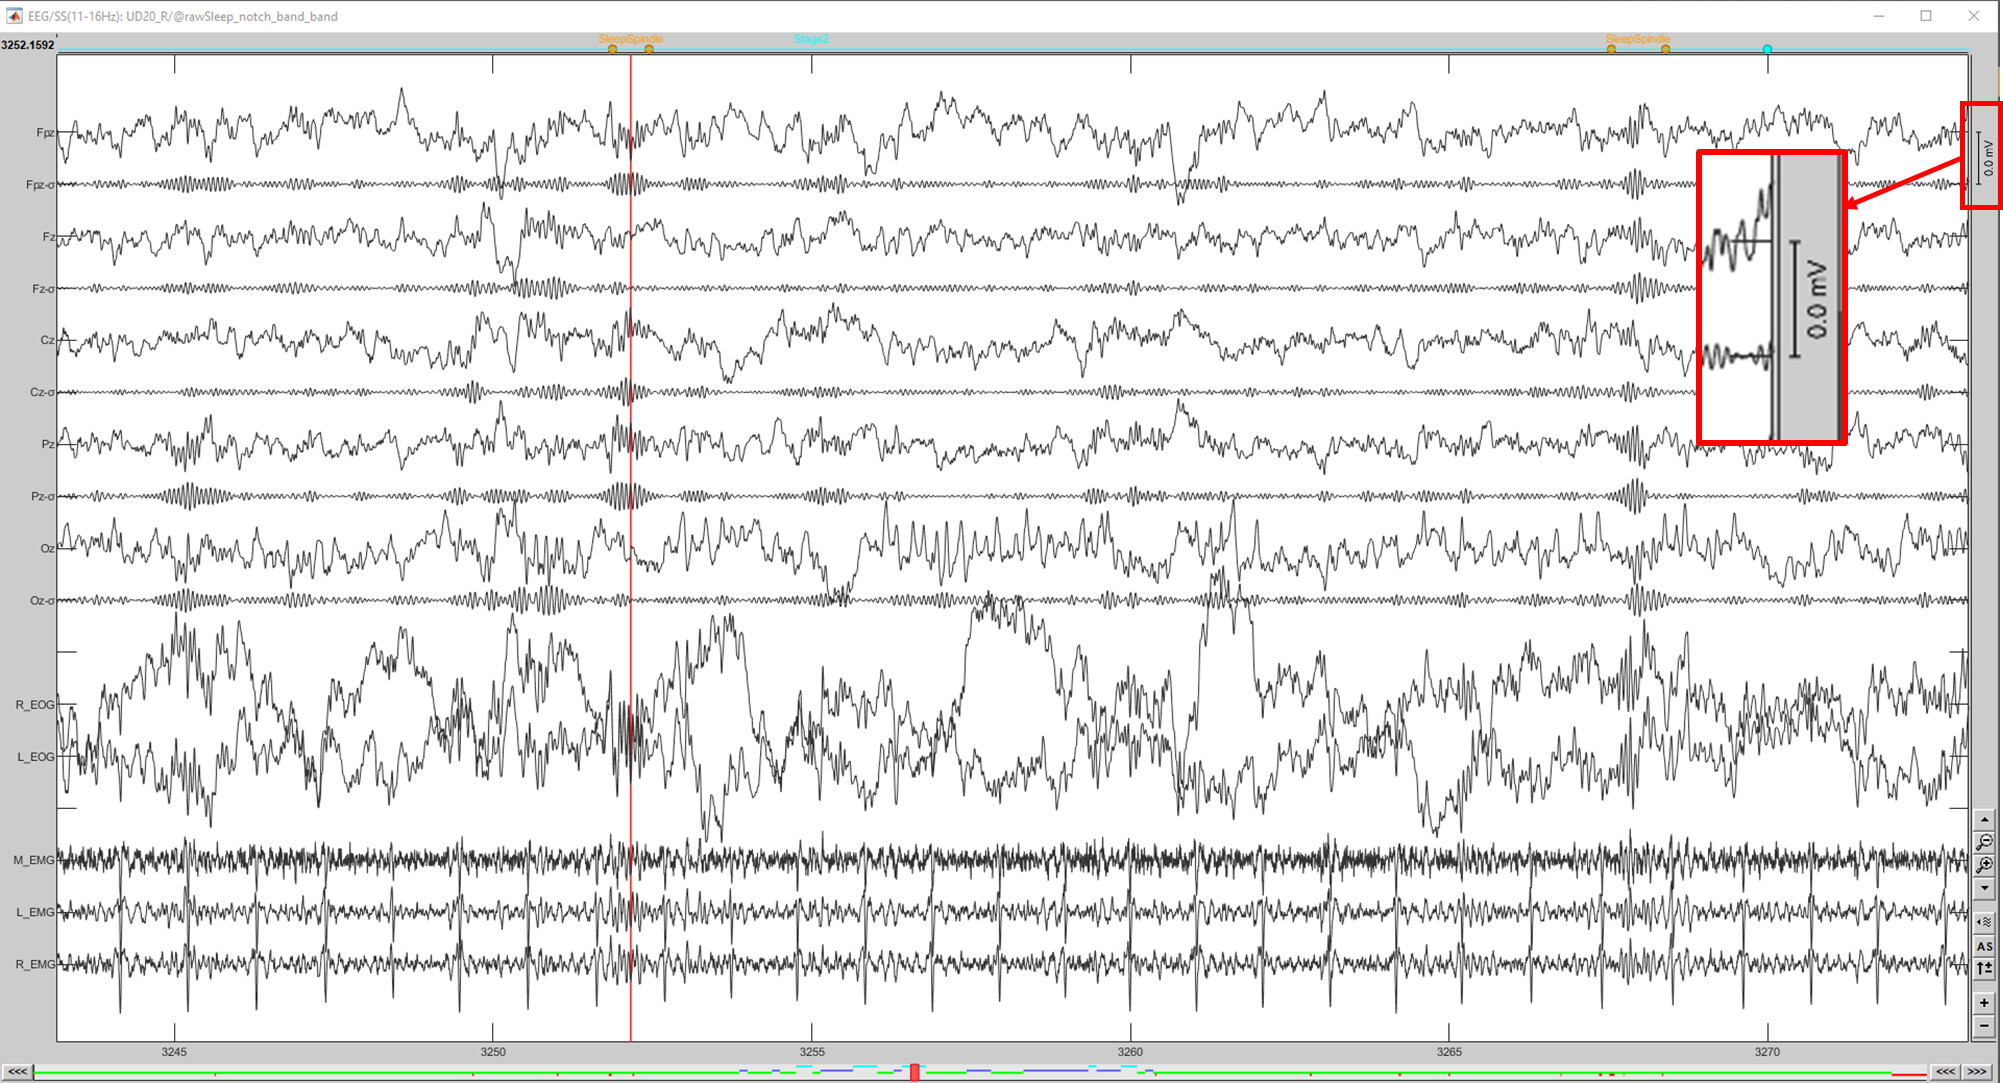
Below I show a 30sec epoch of a raw/continuous recording of a study participant.
I have highlighted the units for the y-axis (amplitude) which is currently in mV.
I need this to be in microvolts so I have adjusted the y-axis scale. However no matter the change, the units are still in mV. I suspect it is showing 0.0 mV because I am now actually within microVolts but the units are just not reflecting that.
Is there a way to change this so that I can see exactly what unit is being used to view the recording?
This may be caused by plotting different modalities (EEG, EOG, EMG) in the same figure. The scale is automatically computed based on the maximum value.
Can you plot the different modalities in different figures?
Brainstorm will handled the time axis to be the same in all the figures
Thanks for the reply!
It is possible to plot EEG, EOG and EMG in separate figures but the above figure is a custom-montage designed specifically to view EEG-EOG-EMG altogether for sleep stage scoring.
Therefore if there is any way to specifically choose the y-axis scale that would be most ideal.
It turns out that if your scale is in mV and you want it to be uV you just have to edit the custom montage to what you see above save and close out of the raw-recording and then open the same raw-recording again with the edited-custom montage already applied and the units will now be in uV