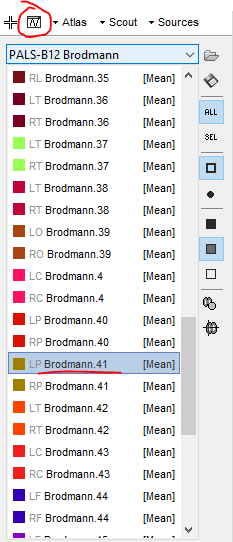
I am trying to view the time series of scout-level auditory evoked potentials using the Scout tab shown below. The scouts are from sLOREA > z-score transformed > absolute value.
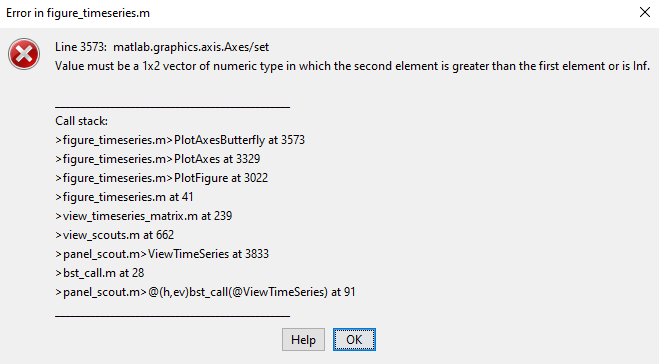
However, I always get the below error message. Interestingly, this only occurs with some folders and the more I try to load additional time series (with the error message appearing again and again) the smaller the scout map brain figure becomes. That is, (from my interpretation) the Brainstorm visualisation process "thinks" that a new time series has been opened and therefore tries to accommodate this new time series figure by adjusting the figure size of the scout brain map by making it smaller and smaller as if the scout time series were actually present.
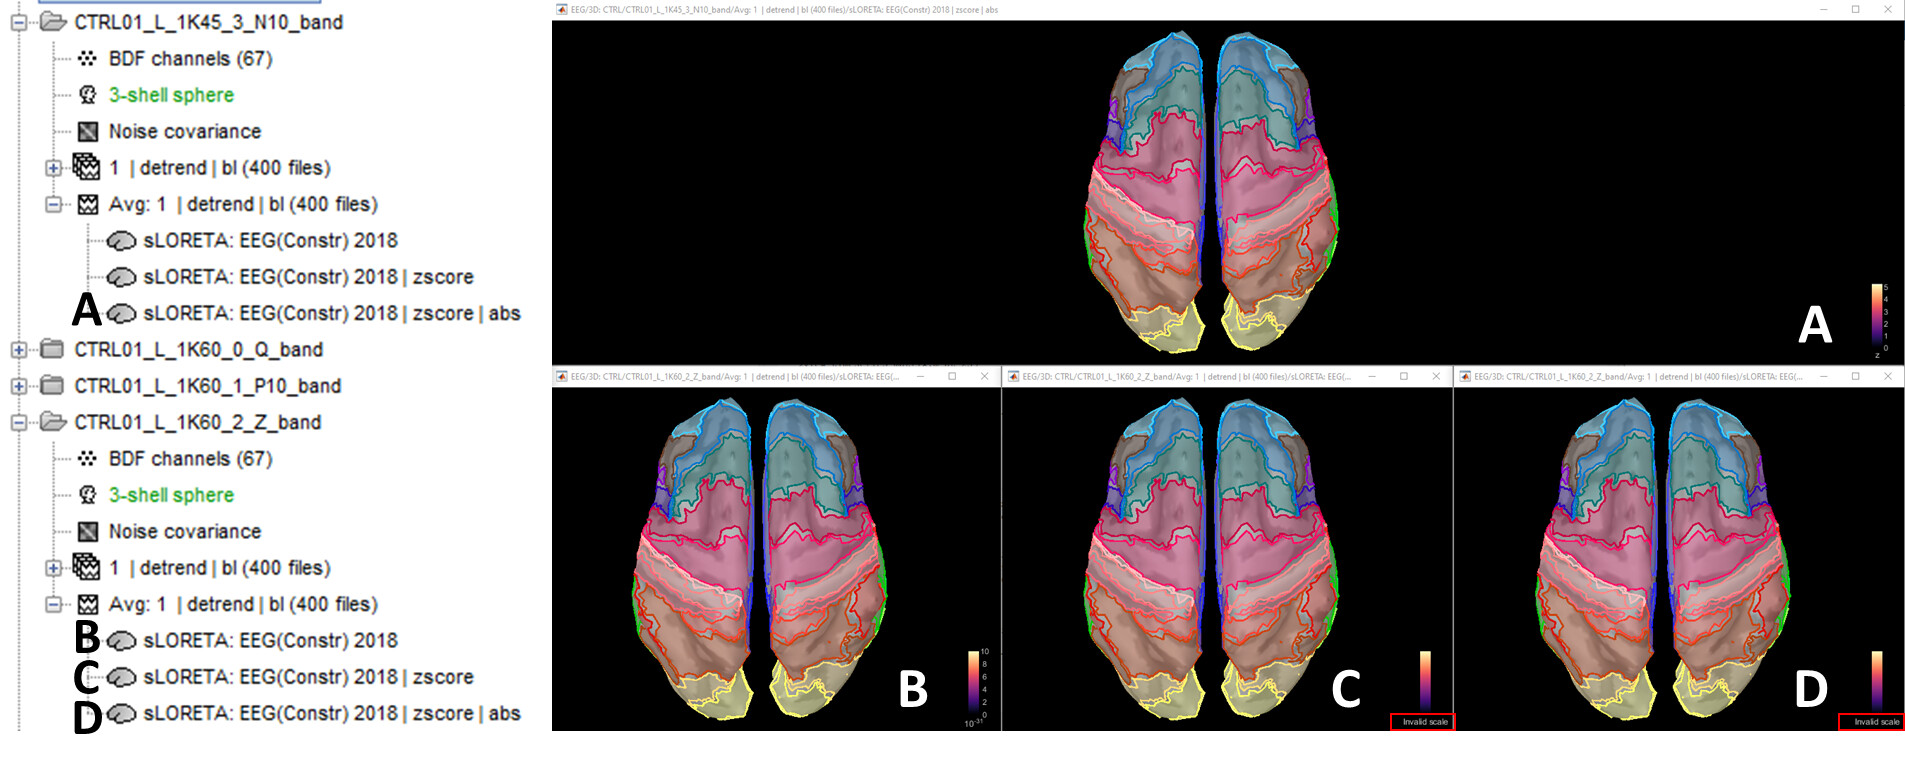
To further investigate this issue I show the below. The below diagram is showing four scout maps from two folders. A is from a folder with no issues. And B to D are from a folder with issues. They are correspondingly labelled in the database tree on the left. The first thing to note is that in scout maps C and D you can (hopefully) see that the units are in an "Invalid scale". Scout map B which is the original scout map from source reconstruction, without zscore transform and absolute value computation, is still showing correct units and labels. Scout map A which IS zscore transformed with absolute value computation (but from a different folder) is also showing correct units and labels. However scout maps C and D are not.
These observations lead me to conclude that the issue is occurring here due to this "Invalid scale" problem and that either the original time series has an issue or something wrong occurred while going through z-score and abs value computation. What do you think?
Thanks for the detailed report. The error message points towards the limits of the (y) axes, thus the issue does not seem related to the number of plots but to the data on some of them. More specifically with the z-score transformation.
Could it be that z-score was computed over one sample?
(Thus, there basseline_std is zero, and the z-score is undefined)
The “Invalid scale” label appears as it was not possible to find an adequate scale for the data.
Export to Matlab the source maps for the files B and C, and check for NaN or Inf values
Thanks for the suggestions Raymundo
You were indeed absolutely right. All the values from the source time series (values from ImageGridAmp) of the source maps of files C and D were NaN. Furthermore, the values from the original source map (without zscore transform or absolute values, file B in the above figure) were also all NaN values. As the original source map was the one with the issue it makes sense that the two follow-up source maps also showed NaN values. Therefore this leads me to believe that during the process of "compute sources [2018]" something must have happened so that the source maps contain NaN.
One thing that I couldn't check is your question below. How would I know that the z-score was computed over one sample? How about I check for that? Regardless, I doubt that z-scoring is an issue here as the original source map is the one causing the issue.
I am at a loss for words about what the issue could be and cannot find anything that I can fix:
I do not think that the process compute sources [2018] is the one with the issue as I've used the same process with the same parameters in a script for all other folders and they worked fine. The screenshot below shows the parameter input that I've provided to compute the sources. The one labelled "ERROR" is the one that you are seeing down below.
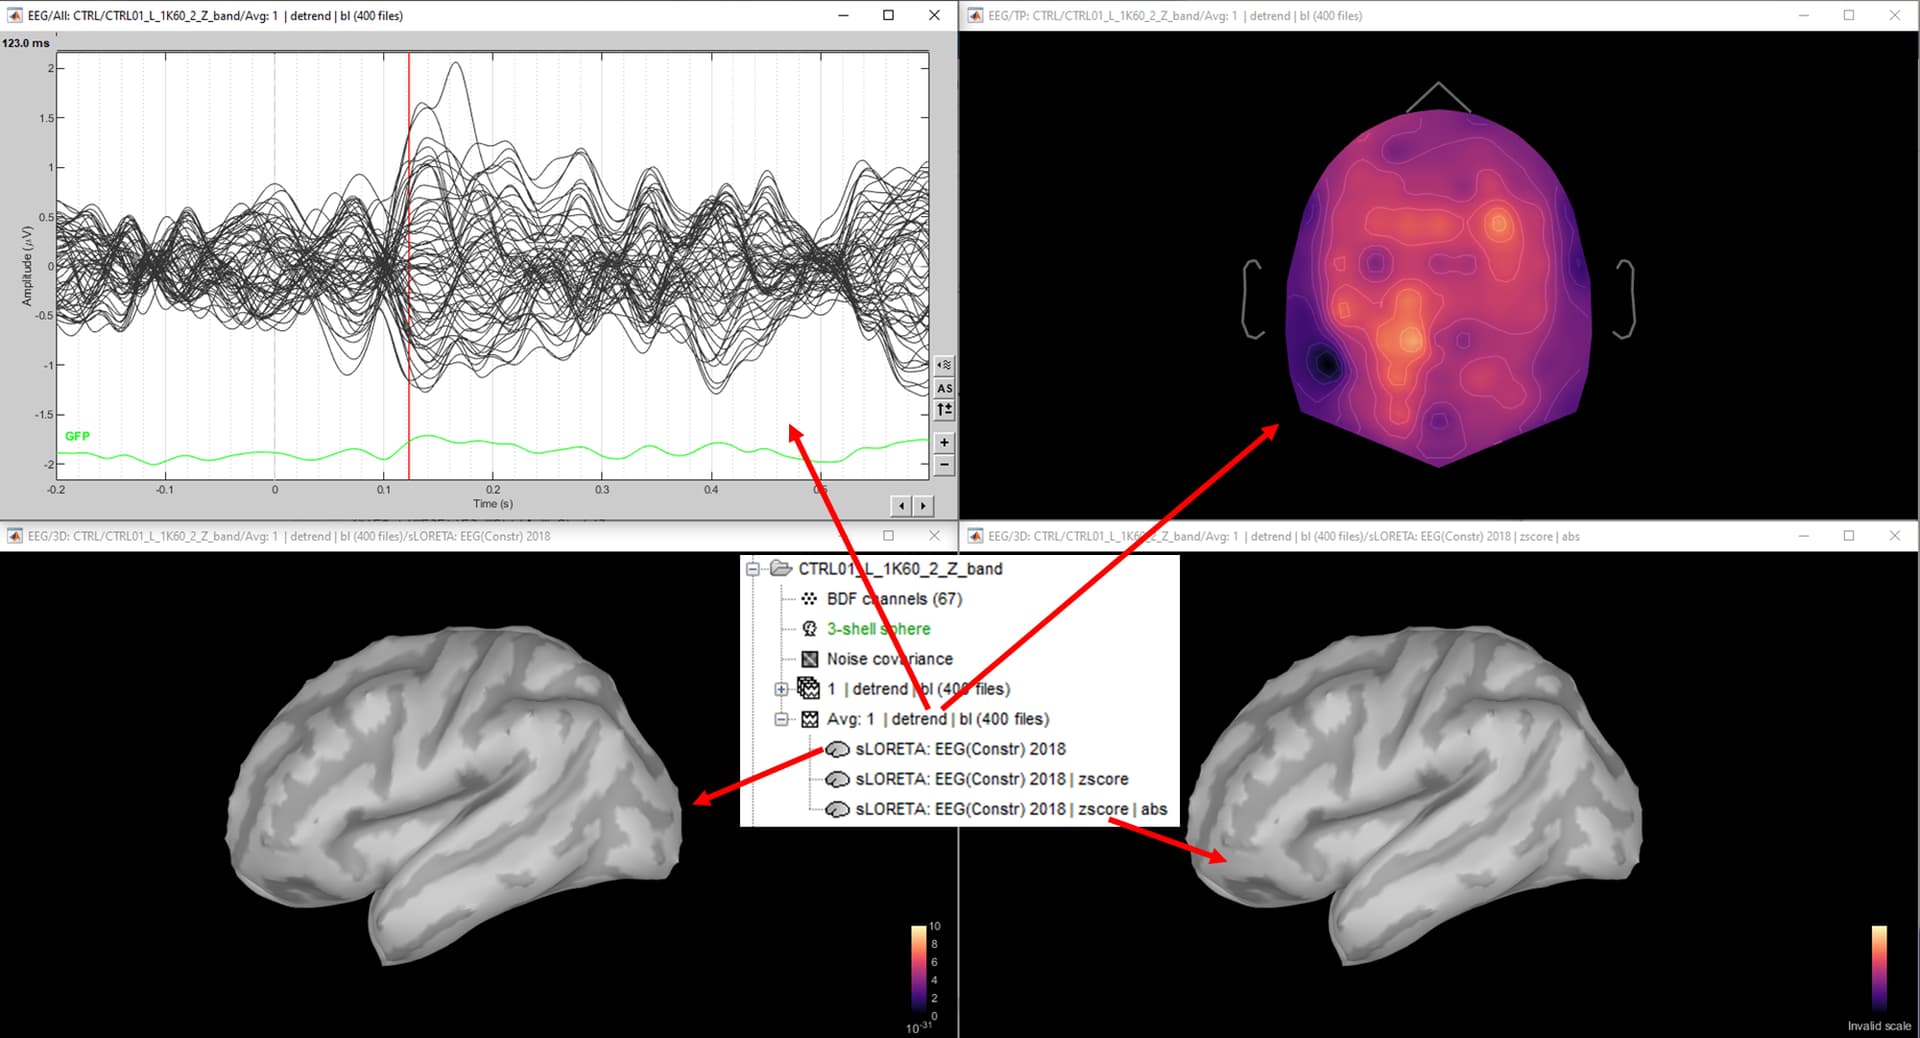
As far as I can tell, I don't think the averaged time series has any issues. The below figure is the EEG sensor level time series (top left), 2D EEG head cap (top right), original source map (bottom left) and zscore-absolute value source map (bottom right; showing "invalid scale"). The two source maps are NOT showing anything because all the values are NaN. I see nothing inherently wrong with the sensor time series and the corresponding topography. The noise covariance was computed from 5 mins of resting-state EEG imported from a different protocol but from the same participant.
I attach the zip file of the folder shown in the above figure if you want to look this over from your end (default anatomy was used - MRI: ICBM152 2023b). The file name means control participant 1, left ear auditory stimulation with 1kHz tone burst at 60 dB nHL with 60 dB SPL white noise in the ipsilateral (left) ear generating 0 dB signal to noise condition. Any help would be highly appreciated! CTRL01_L_1K60_2_Z_band.zip
This info is located in the history of the normalized file, right-click > File > View file history.
It will show the normalization method and the time window, it will be one sample if the window duration is zero of 1/fs
Solved! The problem is your noise covariance.
The noise covariance matrix for the CTRL01_L_1K60_2_Z_band was manipulated outside of Brainstorm. Not sure why this was done. What was tried here? There may be a way to do it using Brainstorm.
Compare the contents between the noise covariance in the folder that is working and the problematic folder. As you will see, the problem noise covariance content is missing fields, among these nSamples which is required. This was hinted by the warning
Warning: Variable 'nSamples' not found.
that appears in the Matlab command window when computing the sources
Hello Raymundo, thanks for this input
Sorry to keep bothering you but the matter is a bit more complicated and not resolved yet.
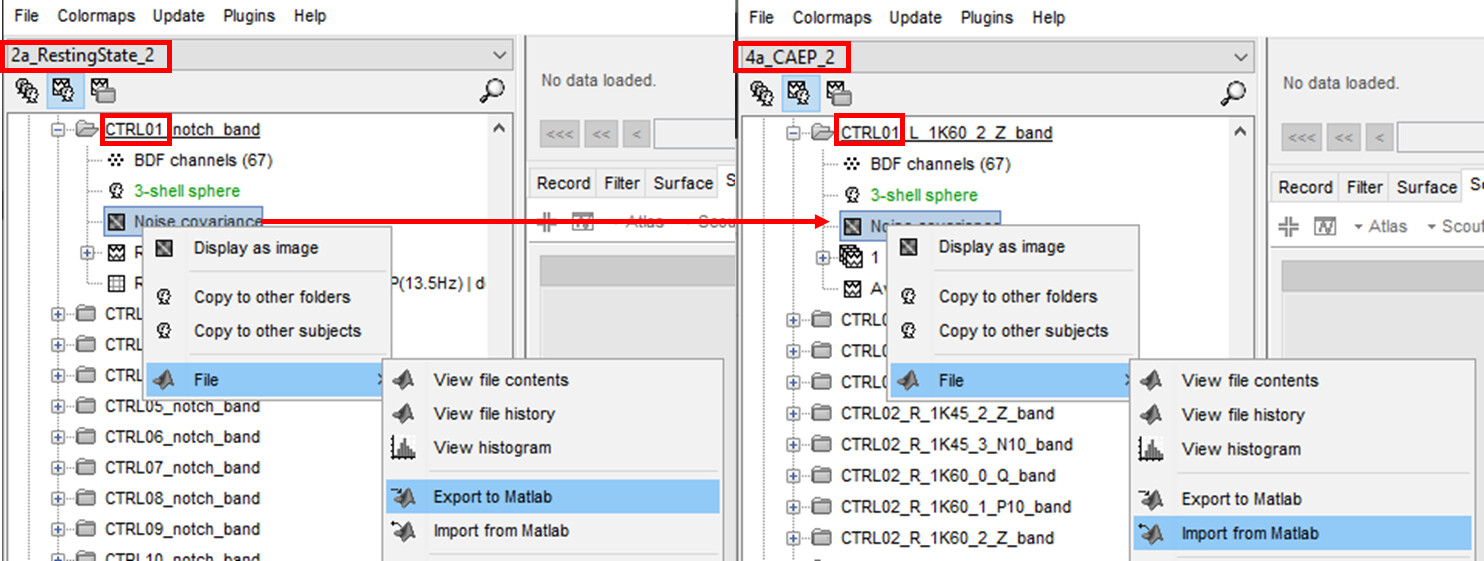
First, let me explain why the noise_cov was manipulated outside of Brainstorm. The noise_cov was computed from a different Brainstorm protocol which was a study on resting-state EEG. My cortical auditory evoked potential (CAEP) and resting-state EEG (RS-EEG) studies are in different protocols. I wanted to use the noise_cov computed from the RS-EEG protocol from the same participant and import that noise_cov into the same participant in the CAEP protocol. I chose not to use pre-stimulus baseline to compute noise_cov as I thought the duration of the pre-stimulus baseline was too short (200 m; with 1024 Hz sampling frequency). Whereas RS-EEG recording duration was 5 mins (with 1024 Hz sampling frequency). The below screenshot shows what I've done; noise_cov from CTRL01 participant from RS-EEG protocol was exported into Matlab workspace and then imported into the CTRL01 participant CAEP file. As there were multiple CAEP conditions (e.g. different stimulus intensities), the same noise_cov file from the same participant from the RS-EEG protocol was imported into multiple folders with the same participant.
Now comes the confusing part... As you rightfully pointed out, the imported noies_cov file did not have nSamples and I saw the same warning that you mentioned. However, a) the problem noise_cov did not have missing fields, and b) nSamples was absent even in folders where everything worked fine. This is odd because if the imported noise_cov file was the issue, all folders from the same participant should have the same issue but this problem is selective to certain folders. I checked to see if the imported noise_cov files were somehow different between folders from the same participant but there was no difference to the noise_cov data between folders and nSamples was missing in both the problematic folder and the correctly working folder. So I do not think the absence of nSamples was the issue as all other source computations managed to work well without nSamples.
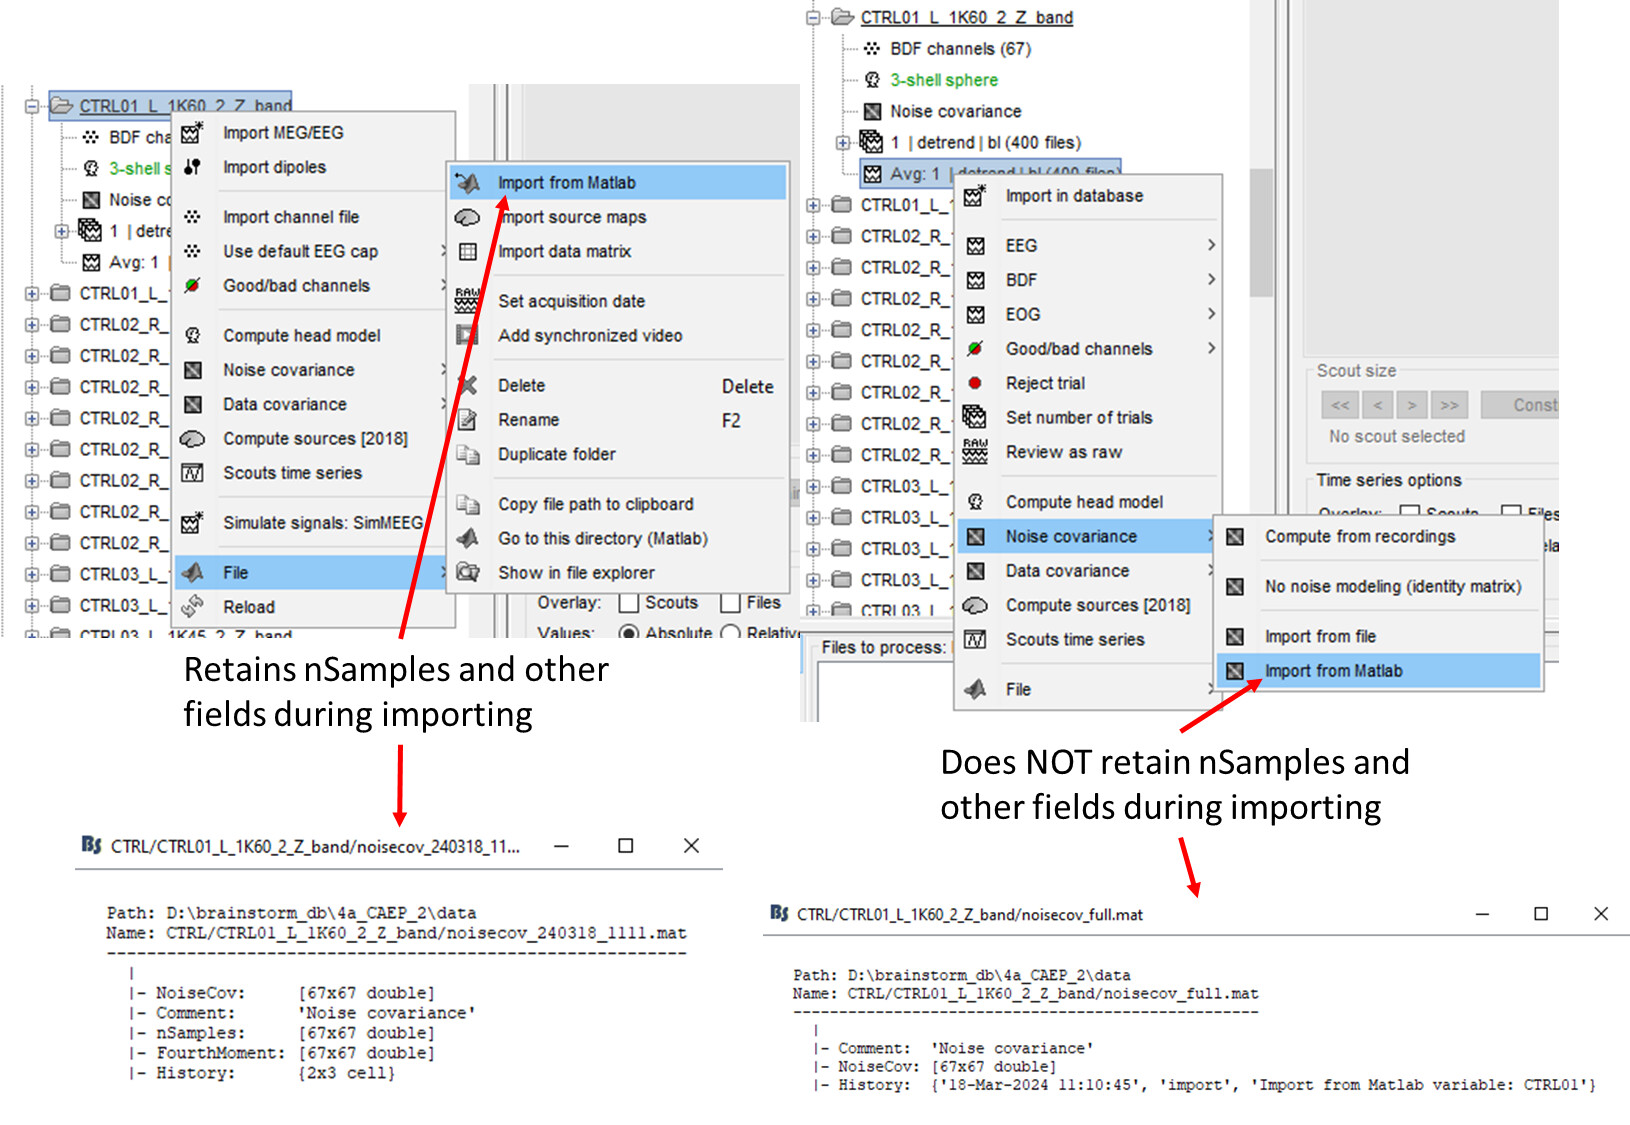
In attempting to troubleshoot this problem I re-exported the noise_cov file from CTRL01 from RS-EEG protocol into Matlab workspace possibly thinking that the exporting process had issues. Interestingly, the noise_cov file that I just exported did contain nSamples as one of the fields. It wasn't until later that I realised that the issue was during the IMPORT process. If you import the exported noise_cov file using folder click > file > import from Matlab, everything that you've exported (as in the entire struct containing nSamples and, etc) is imported. However, if you import the exported noise_cov file using averaged trial recording click > noise covariance > import from Matlab, then several fields including nSamples is removed from the struct during importing (noise_cov data is identical; just with missing fields from struct). Not sure why this is the case maybe the BST team may need to look into this?
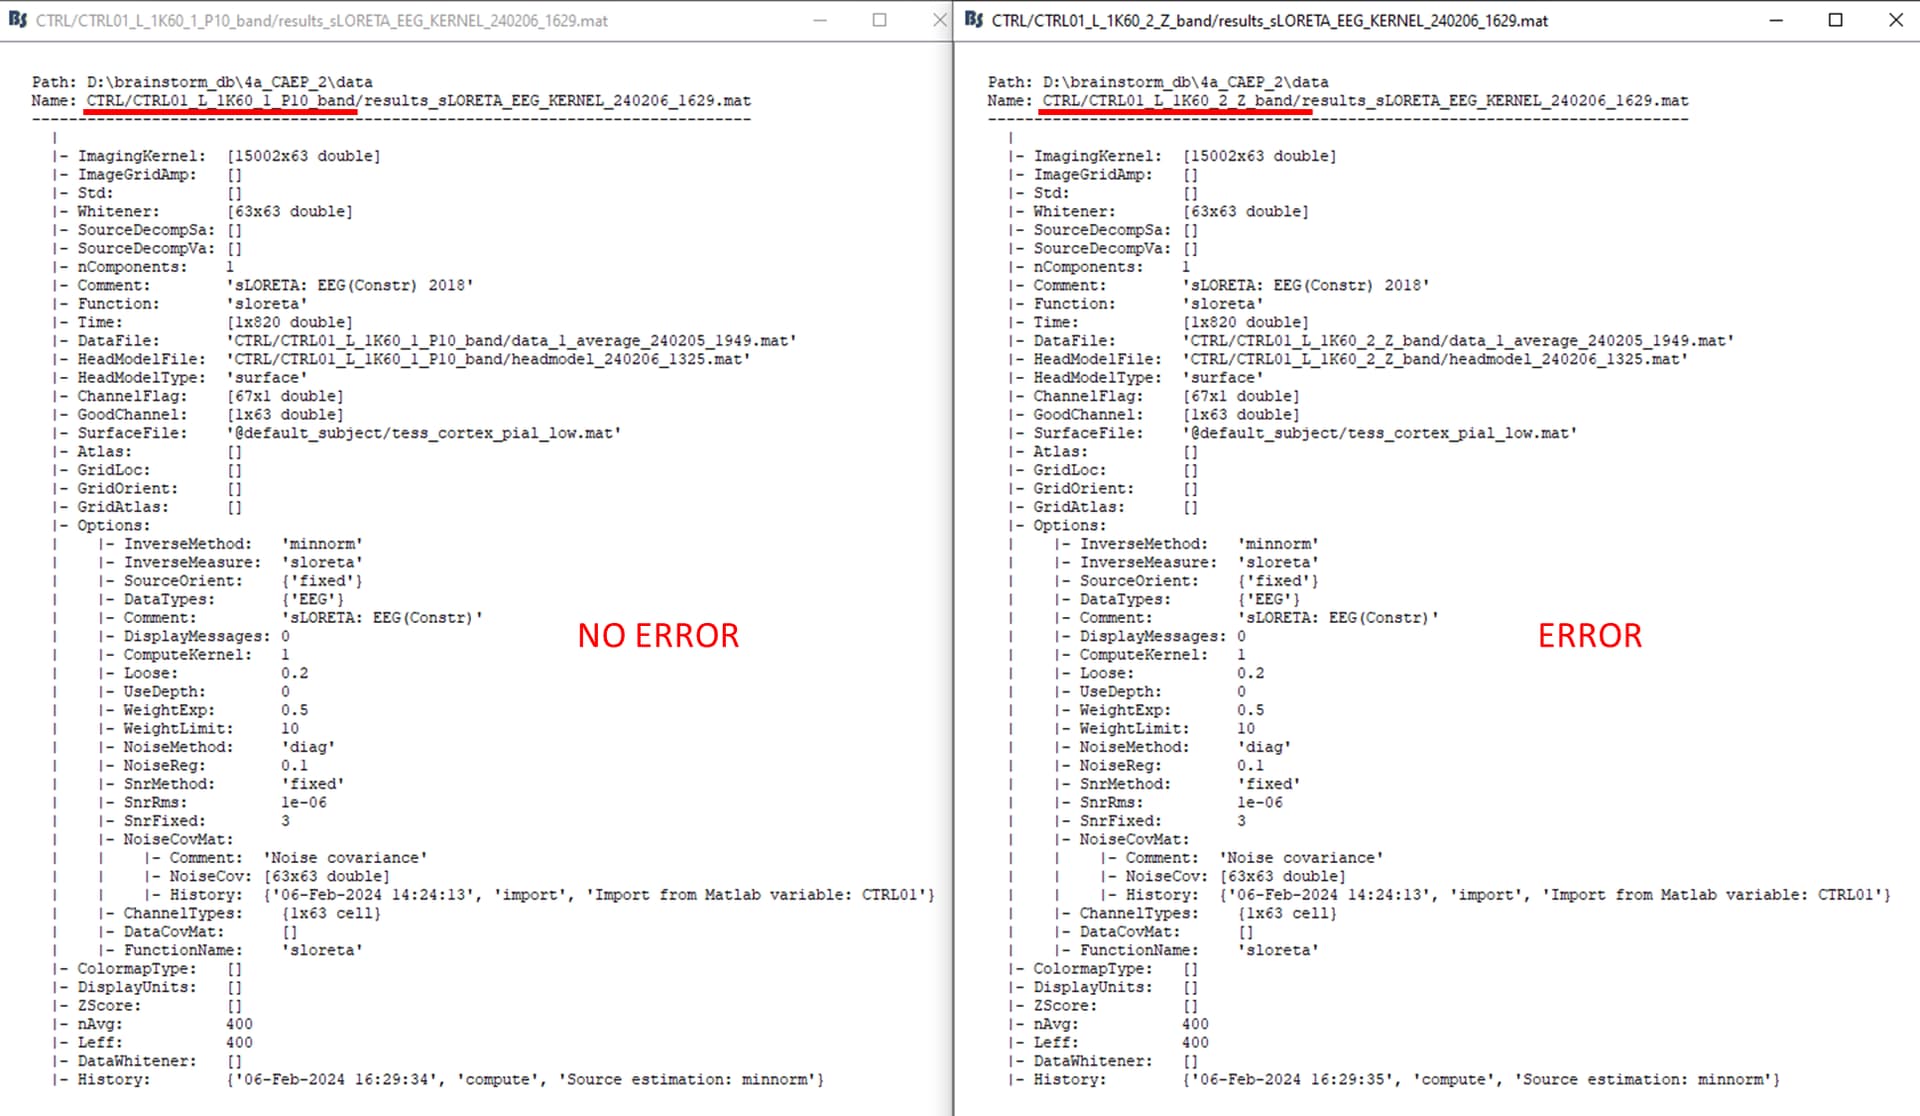
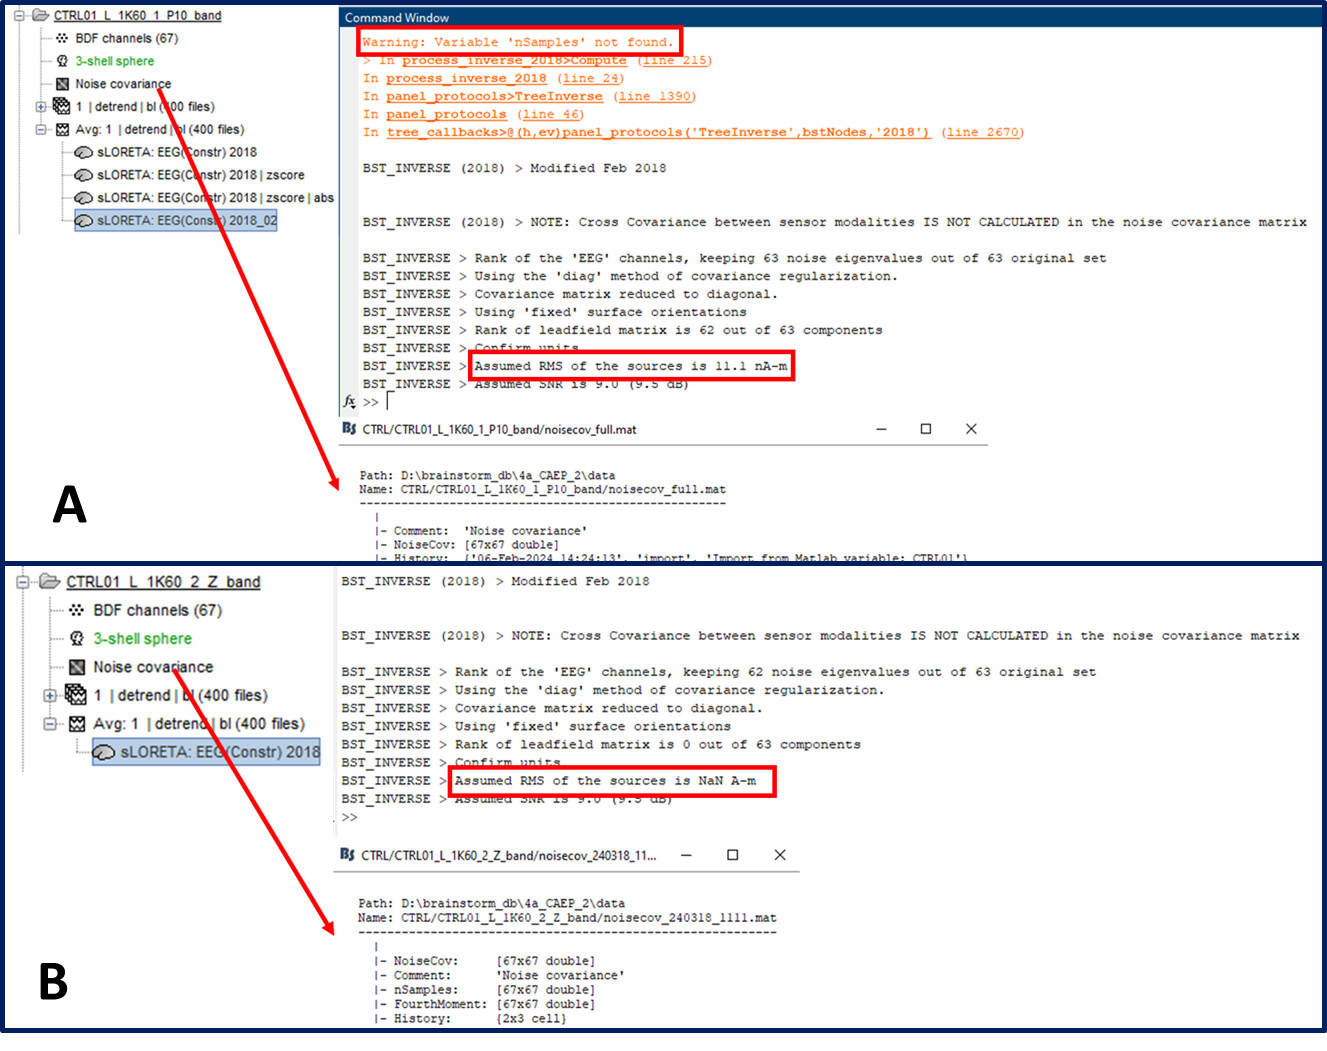
Anyway, subsequently to the above, I first deleted the noise_cov that was the issue and re-imported this new noise_cov into the folder with issues (CTRL01_L_1K60_2_Z_band) and ran compute sources. As expected, due to the presence of nSamples there were no warning messages. However, the source computation values were all still showing NaN. So I compared the messages that Bst gave me in the Matlab command window when I ran compute sources [2018] between the good and the bad folders and the following was what I observed. A and B shows the outputs from the "good" and "bad" folders respectively. A: has noise_cov that does not have nSamples and other fields due to being imported through "averaged trial recording click > noise covariance > import from Matlab" and therefore you can see in the Matlab command window "Warning: Variable nSamples not found". B: has noise_cov that contains nSamples and other fields due to being imported through "folder click > file > import from Matlab" and hence you cannot see the same warning (I also show the noise_cov file contents to further illustrate my point). I should remind you that he noise_cov data itself are identical between folders.
What is troubling is the part that says "Assumed RMS of..." I think this is the part that is causing the issues. A, which does not have nSamples is still showing a numerical value for "Assumed RMS of..." but B even though it has all the fields of noise_cov shows "Assumed RMS of the sources is NaN A-m". Although I think this is the issue I have no clue how to correct for this.
What do you think about all this? I share the folders that I am showing in the figure immediately above. I've labelled them GOOD and BAD to illustrate which is which. My apologies for such a lengthy and detailed post (just want to properly troubleshoot this phenomenon with your help). Many thanks for your time in advance. CTRL01_L_1K60_1_P10_band_GOOD.zip CTRL01_L_1K60_2_Z_band_BAD.zip
Is it the case that the (RestingState) recordings used to compute the noise covariance matrix, and the (CAEP) recordings do not have the same bad channels?
You could check this with right-click > Good/bad channels > View all bad channels
Thanks for these replies Raymundo - appreciate your time.
I considered the possibility that the number of bad channels may be different between CAEP and resting-state recordings. This is indeed true. Resting-state recordings have PO3 and POz (row number 26 and 30 respectively) as the bad channels. However, this still doesn't explain what we are seeing here as both the Good and Bad folders that I've shared with you have only PO3 as the bad channel. Therefore there is the matter of discrepancy between the number of bad channels yet this strange behaviour is only being expressed from the Bad folder.
The difference in bad channels, does explain it.
They must have the same bad channels, the fact that it works for the good folder is only chance.
This is the long explanation: one difference between the good and the bad folders is that in the first, one SSP component is removed, and in the second no component is removed when doing EOG artifact removal. When computing the inverse model the noise covariance is loaded, and as expected, the rows and columns for the bad channels (PO3 and POz) are zeros. Then, when computing the inverse model, the existing projectors (in the channel file) are applied to the head model and to the noise covariance. In the case of the "good" folder, the SSP projector was computed with POz (channel 30) as good channel, then when this projector is applied on the noise covariance, it removes the zeros on the row and column (30), as consequence the following steps work.
Thank you for the reply Raymundo; I just changed the number of bad channels to match the bad channels from the resting-state recording and everything worked fine
As the different number of bad channels (compared to the resting state bad channels) seemed to work fine with the good folder I assumed that this wasn't the cause of the issue - many thanks again and sorry for taking so much of your time.
Just out of curiosity, regarding your comment down below, what do you think may be the reasons that having a different number of bad channels just worked for this good folder by chance?
It worked because of the Component #1 that was removed in the SSP projector. Applying that projector in the noise covariance, refilled the row and column for channel 30.
I added an error if the bad channels from the noise covariance and the bad channels in the recordings are different. Commit 91b65cc.