Hi!
Thank you for the robust epileptogenicity tutorial to preprocess and visualize sEEG data.
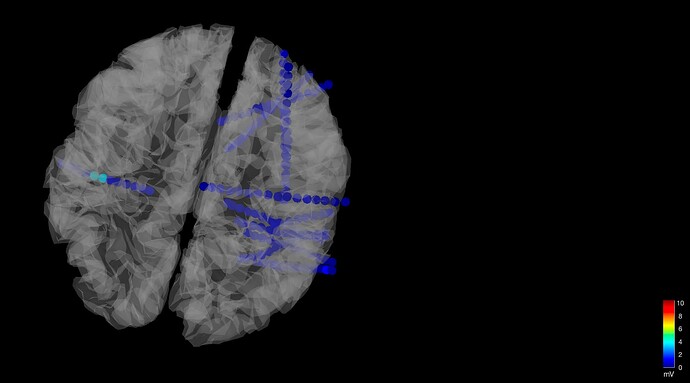
Main: My goals are twofold (partially explained under " Display the SEEG recordings" of the tutorial), and I wonder if anyone has experience/insights.
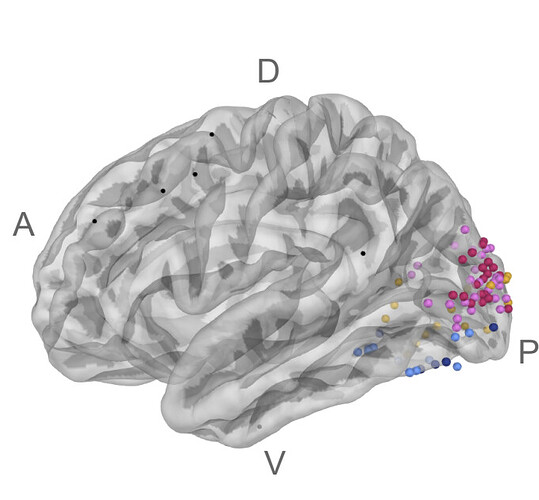
(1) I want to display various contacts (coming from different patients) in a brain where I can (2) change the contact color depending on a magnitude I calculate independently (e.g., electrode selectivity). See example of figure below (ref: https://www.biorxiv.org/content/10.1101/2023.09.13.557378v2.full.pdf)
- If I have the MNI coordinates for the contacts, how can I integrate that data into one plot? When I load data from one patient, I noticed it is handled as a shaft/electrode with contacts, and I would like to have a way to upload every contact independently.
- How can I systematically change the color? I am thinking of having a matrix that I could upload into Brainstorm and adjust the color, etc.
Thank you!

