Hi Francois
I created epochs of -199.2 ms to 1000 ms with weighted averages of multiple subjects (I tried to set initial value to -200 ms but Brainstorm automatically changes it to -199.2 ms). My EEG task involves presentation of visual stimuli (triggers set at 0 ms for each epoch). I selected the remove DC offset option with the default time range in Brainstorm (-199.2 to - 3.9 ms). I had previously applied a high-pass filter of 0.5 Hz but found that channels in the epochs were varied at baseline (wide range of μv values that were sometimes distant from 0 at baseline). Could you advise how I can appropriately select the time range for the DC offset or should I use the default one in Brainstorm?
I tried to set initial value to -200 ms but Brainstorm automatically changes it to -199.2 ms
It rounds to the nearest time sample. There is a data point at t=0ms, but depending on your sampling frequency you may not have exactly one value recorded exactly 200ms before.
I had previously applied a high-pass filter of 0.5 Hz but found that channels in the epochs were varied at baseline (wide range of μv values that were sometimes distant from 0 at baseline). Could you advise how I can appropriately select the time range for the DC offset or should I use the default one in Brainstorm?
There is no such thing as a recommended baseline in Brainstorm. What you see as a default option in the import window is simply all the the time available before 0. If you had imported 2s before the stim, you would get 2s of baseline by default.
The high-pass filter at 0.5Hz is always sufficient to remove "the DC offset in the signal", as it ensures that by windows of 2s, the average in time is zero. If you consider you have some physiological "noise" above 0.5Hz that makes your data impossible to process (eg. it covers the ERP components you want to observe), you could try either to use a high-pass filter at a higher frequency (which would also remove all the brain processes that lead to sustained activity in some regions) or remove the average over a shorter baseline just before the stim (but the effects of this solution can lead to unwanted results - if your data is noisy, the baseline average over 100ms or 200ms can be somewhat random)
For the duration of the baseline to use: it entirely depends on your experimental design and hypothese.
https://neuroimage.usc.edu/brainstorm/Tutorials/Epoching#Epoch_length
Hi Francois,
Thank you. I used a visual task and followed the below steps.
Band-pass filter between 0.5Hz and 30Hz.
Down-sample to 256 Hz.
Re-reference to subject average.
ICA to remove oculomotor artifacts.
Import epochs (-200 to 1000 ms) for outcomes on correct response trials only. Remove DC offset (-200 to -0.1).
Remove channels with artifacts +/- 100 µV.
Average trials for each subject for each outcome.
I copy below two examples of averaged responses for two subjects from parietal-occipital EEG electrodes. The top in both examples is without "Remove DC offset (-200 to -0.1)" step and the bottom is with this step in the analysis pipeline. As I understood it, the remove DC offset re-sets channels to 0 at baseline, but this doesn't seem to happen after high-pass filtering at 0.5 Hz alone?
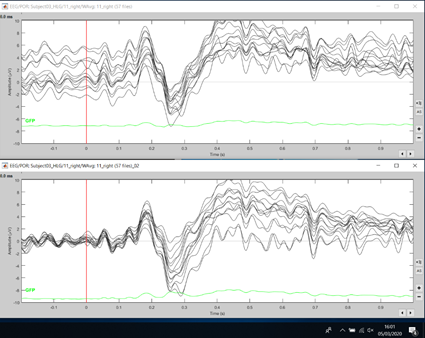

Indeed, it does "look nicer" if you center the signals based on the average over a 200ms pre-stim baseline.
However, keep in mind that depending on your experiment, the values on your baseline could be meaningful, even if there are non-zero (eg. the brain is still doing something related with the previous stimulus when you present the next one). If your hypothesis is that between -200ms and 0ms wrt to any stimulation there is no sustained brain activity and no time-locked transitory activity, then it is OK to try to have the signals close to zero. But be careful: this is not always the case, it depends on your experimental design.
To help you decide what is more meaningful, you could also look at the scalp topography at the latencies of interest, check if the distributions of potentials match better your hypotheses in one case or the other.
Thank you. Do you mean check the scalp topography at the latencies of interest at baseline or throughout the epoch? I'm assumed the remove DC offset option would not affect the distribution of activity in the sensors after the presentation of the stimulus (at 0 ms in the epoch).
Regarding my hypothesis, I am replicating an experiment from another study by a different research team using the same task. They didn't have a hypothesis over the range of the task or at baseline. Their experiment centered on four components: N1, P2, P3, and LPP. I have two groups in my experiment that I want to compare on ERPs centered on these 4 components. In their experiment they used the same filters I mentioned above, except for the DC offset step. However, their signals were all centered around 0 at baseline.
Whenever you think this is relevant for your experiment.
I'm assumed the remove DC offset option would not affect the distribution of activity in the sensors after the presentation of the stimulus (at 0 ms in the epoch).
Of course it does. For each channel, it subtracts the average during the baseline from the entire epoch.
https://neuroimage.usc.edu/brainstorm/Tutorials/Epoching#Import_in_database
However, their signals were all centered around 0 at baseline.
How, if not by explicitly centering the baseline on zero?
If you used exactly the same experimental design and there is no baseline correction in your reference experiment, but the baselines look radically different in your case, then there is maybe something different related with the data acquisition.
Hi Francois,
Thank you. That clarifies things. I‘m trying to replicate the analysis from the reference study on my data comparing two groups in Brainstorm.
In the reference study, to identify significant between-group differences across outcomes, they used a combination of the Monte Carlo test and non-parametric bootstrapping running 4,000 permutations calculated following a component-free approach across the entire array of electrodes for every millisecond. They then placed electrodes with significant results (p < 0.01) into 6 ROI, and the activity within such regions was averaged out. The 6 ROI were left and right frontocentral, centro-parietal and parieto-occipital with 14 electrodes (from 128 channels) assigned to each ROI. Then they compared the average activity from the six ROIs using 4,000 bootstrapping permutations (p < 0.05). Such contrasts were independently carried out in three time-windows (early: 100–250 ms; intermediate: 250–500 ms; late: 500–900 ms) for each condition, and group.
For my study, in Brainstorm, after pre-processing and obtaining weighted averages for each subject, I then place all weighted subject averages in Process 2 (Files A for one group and B for the other) and run Test > Permutation test: Independent running 4000 permutations. I identify the significant electrodes within each ROI as determined in the reference study and average them. I placed the pre-determined 14 electrodes into 6 montages to make it easier to find significant electrodes in each ROI. I then re-run Test > Permutation test: Independent running 4000 permutations on the averaged significant sensors (entering significant sensors in “Sensor types or names” and selecting the option “Average over channels”) for each ROI and for each time period to obtain the group difference (potentially 6 ROI x 3 time periods = 18 permutation tests).
Could you advise if this appropriately replicates the above analysis from the reference study in Brainstorm?
If you want to replicate your reference study, the best approach would be to ask the authors to share their processing scripts, and adapting it to your data. Otherwise, you would never be able to know if the differences obtained are due to a non-replicability of the published experiment, or simply differences in the processing pipeline.