Dear All,
Is there in brainstorm a function to measure the Sensitivity of MEG and EEG to Source Orientation?
Best,
Dear All,
Is there in brainstorm a function to measure the Sensitivity of MEG and EEG to Source Orientation?
Best,
Hi Abdallah,
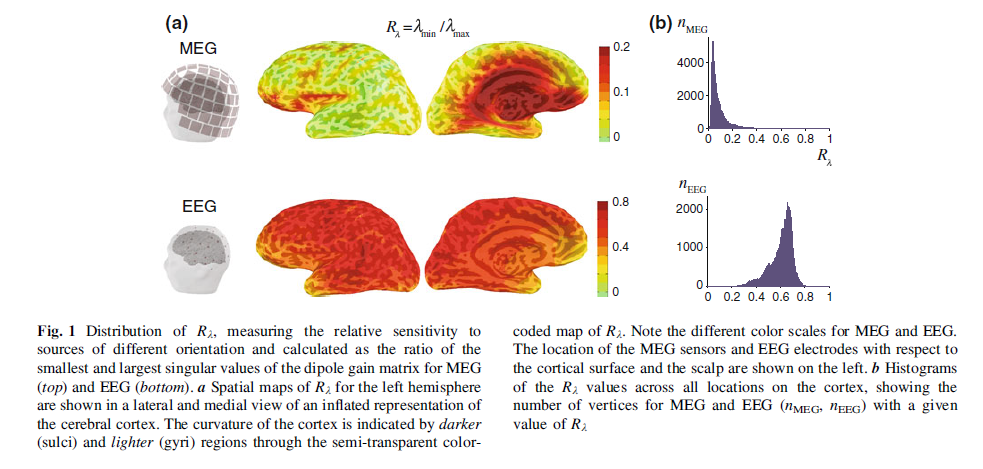
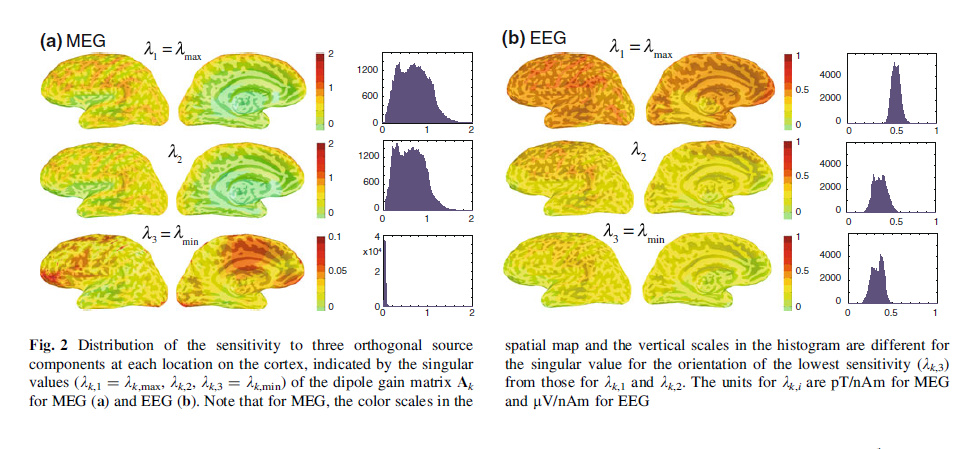
In principle the unconstrained lead field matrix gives the sensitivity of the MEG and the EEG to sources in all directions.
Kind regards,
Steven
Thank you for your answer, can you please let me know how can I visualize it, like the attached figure, do you have an idea about it?
Best regards
It's all described in the paper. They extracted the forward field for each source from the lead field matrix. This latter is available in the head model file of Brainstorm. You can then reproduce the operations described in the paper using a custom made script you will need to write. It will yield an array of values, one per source location, which you can store in the ImageGridAmp variable of a Brainstorm source file. For this, I recommend you create one from the Brainstorm GUI and then replace the contents with your ImageGridAmp values.
I hope this helps.
Thank you!
to my knowledge I think forward field is the same as lead field, so what do you mean by: They extracted the forward field for each source from the lead field matrix,
These terms are indeed confusingly interchangeable: foward fields are the columns and lead fields are the rows of the "lead-field" or "gain" matrix derived from head modeling.
Thank you so much @sylvain, you make my day!
Infact I found in mne too a sensitivity analysis map computation,
but I donot know how can I switch now to mne,
With BST I just modified the channel (by exporting it to matlab and make some modification)
the issue as i see that mne accept fif file and bst do not export to fif file.
and I do not know how I can modify the channel in mne,
Hi @Sylvain @Francois
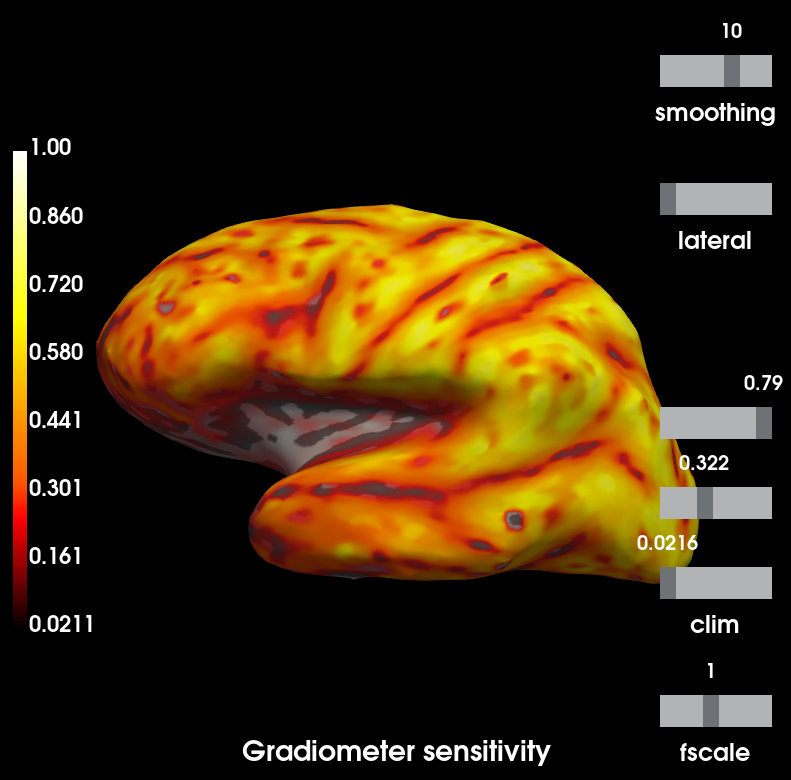
I have succeed to obtain an array of values, one per source location,
now how can I ploted with BST to have something like that:
Cheers
Abdallah
I have succeed to obtain an array of values, one per source location, now how can I ploted with BST to have something like that
The easiest is maybe to first create a template source file in the Brainstorm database which is similar to the file you want to obtain: maybe compute a source file in Brainstorm, average it in time to obtain only one value (replicated for the beginning and the end of the time segment), and the replace the ImageGridAmp matrix with your own values (export to Matlab/modify/import back, or directly modify the .mat files). Then display the file as if it was any Brainstorm file.
The data structures are documented in the sections "On the hard drive" of the tutorials, and the tutorial Scripting will give you a lot of information on how to manipulate Brainstorm files and structures:
https://neuroimage.usc.edu/brainstorm/Tutorials/Scripting#File_structures