Dear BST team,
I'm working on an EcoG project, where I've imported and preprocessed each subject's anatomy and set EcoG electrodes location using brainstorm. However, I am also running some analyses using custom matlab scripts. I would like to integrate these analyses with BST's plotting and visualization capabilities, so that I can assign each electrode marker an individual face color or size from a gradient of values representing the range of results of my external analyses.
I know that I can set marker size and marker face colors by using the figure handle to change current object properties thusly:
% create 3Dviz figure for sample subject
SurfaceFile = 'C:\LocationInDrive\tess_cortex_central_low.mat';
ChannelsFile = 'C:\LocationInDrive/channel.mat';
[hFig, iDS, iFig] = view_surface(SurfaceFile);
[hFig, iDS, iFig] = view_channels(ChannelsFile,'ECOG',1,0);
% set electrodes marker size and color
hFig.CurrentObject.MarkerSize = 8,
hFig.CurrentObject.MarkerEdgeColor = [0 1 0]).
hFig.CurrentObject.MarkerFaceColor = [0 1 0]).
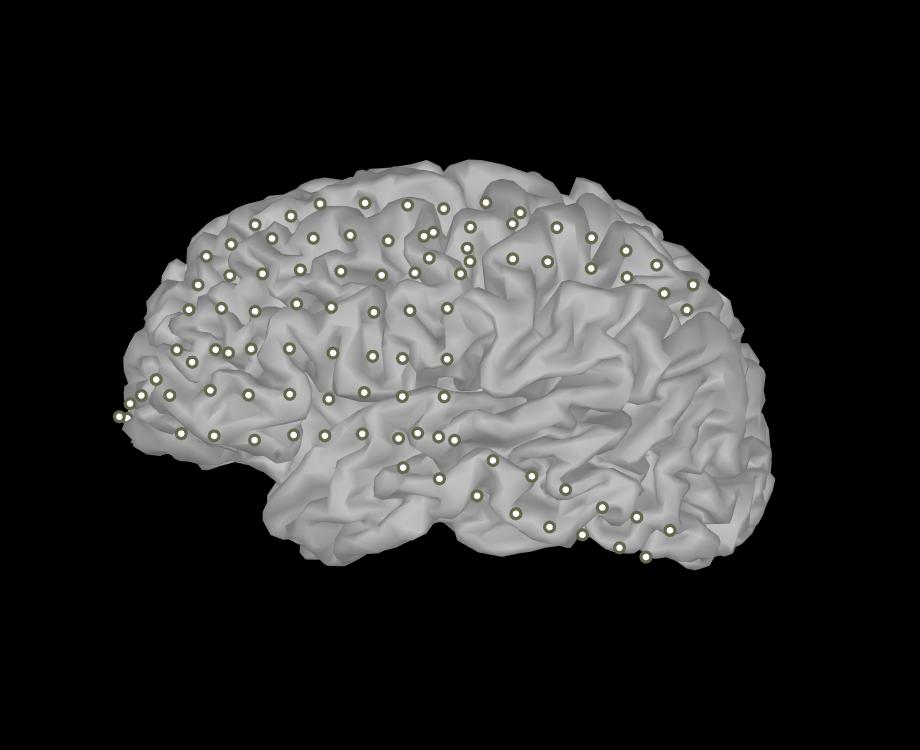
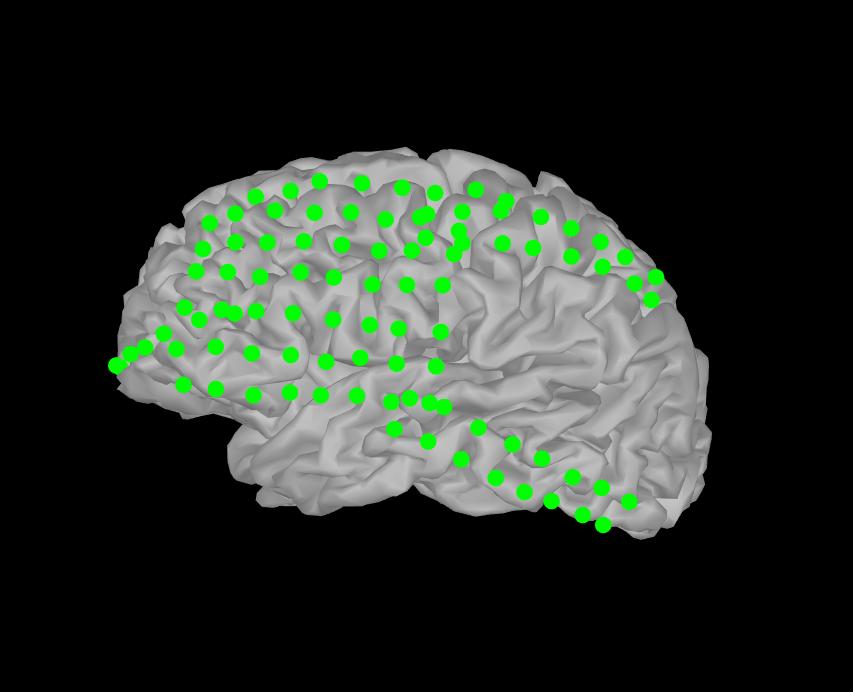
However, this will change all electrodes to the same size and color values, as shown in the attached files. I was wondering how to set each marker (i.e. electrode) to have an different color or size, asuming I already have a color and size value per electrode in separate matrices.
I assume I would need to access the data in hFig that specifies the location of each electrode and then write a loop to plot each electrode individually, setting the desired properties at each iteration, but I'm unsure how to access marker location or whether setting these properties per electrode is actually possible.
Any help, idea or feedback about how to get this done would be highly appreciated.
Thanks in advance!
It is not possible in Matlab to use the Marker properties individually for each vertex of a patch, surface or line object.
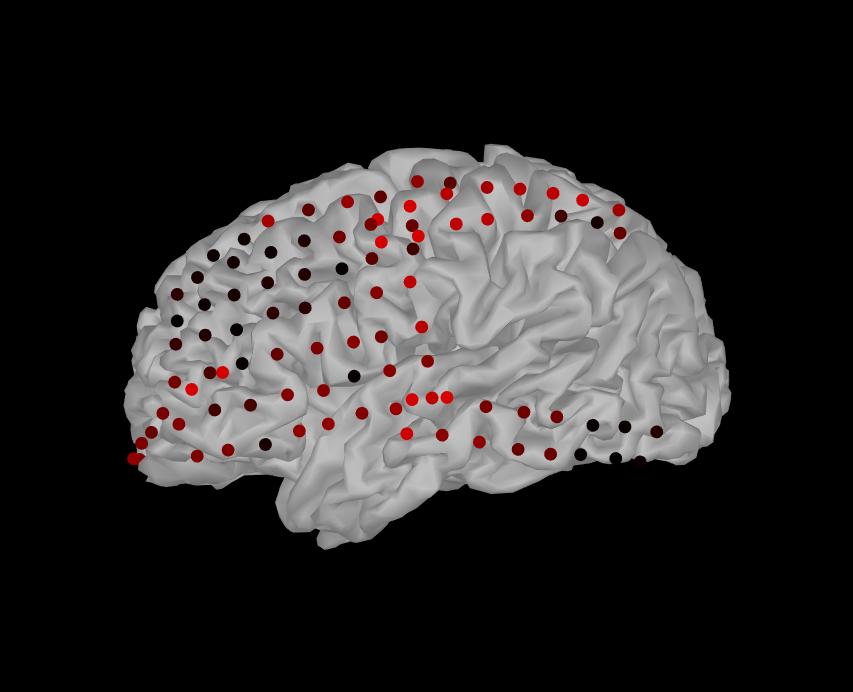
To plot different colors for different electrodes, as in the EEG/SEEG/ECOG displays, we create a much larger patch object,the geometry of each electrode being fully represented as a sphere or cylinder, and the colors are associated to each vertex using the FaceVertexCData property in figure_3d.m.
It is quite complicated to work this way. If you want to set one value per ECOG contact and display them using Brainstorm, it might be easier to create some "data" files (like imported epochs) containing the values you want to display, and then simply use all the Brainstorm functions to visualized them.
The data structures are documented in the section "On the hard drive" of the introduction tutorials, and in the Scripting tutorial:
Otherwise, you can plot the graphical elements you want manually in the Brainstorm figures.
You will find the coordinates of the electrodes in the channel file:
Thanks a lot for your response and ideas Francois. Indeed, manually plotting the elements using the electrodes coordinates available in the channel.mat file on the BST figure is the easiest and most customizable option.
Hello, I have been doing similar work with you recently, could you please share how you completed it, thank you very much
@YingZhu, the method described in the post above provides large flexibility as it is possible to plot anything at the sensors locations. However, it requires coding from the user side. If you are comfortable with it, check this page that indicates where in the channel file is the location data for each sensor:
https://neuroimage.usc.edu/brainstorm/Tutorials/ChannelFile#On_the_hard_drive
If you are looking for a less-coding option, please create a new question in the forum, providing information on the type of data that you are working with, and the expected visualization. There are plenty options already built in Brainstorm for sensor data visualization, and one of them may already make the visualization that you require.