Thanks for your reply!
Here is the main procedure that I used:
1.The standard MNI template ICBM152 was used to create the head model, via the boundary element method implemented in OpenMEEG.
2.To obtain the source maps in loss and gain conditions, the current density maps were computed from the ERP time series using the minimum norm imaging for each condition in each subject separately.
3.The source orientation was constrained to be normal to the cortex. Each subject’s current density maps were normalized (z-score) with the baseline period (-200 to 0 ms).
4.For each region of interest, I extracted the source activities for Loss and Gain conditions for each subject separately. The different waveform between Loss and Gain conditions was calculated to create the FRN-like component in the source activities.
5.The group-wise Loss, Gain, and FRN-related source activity were averaged across all subjects.
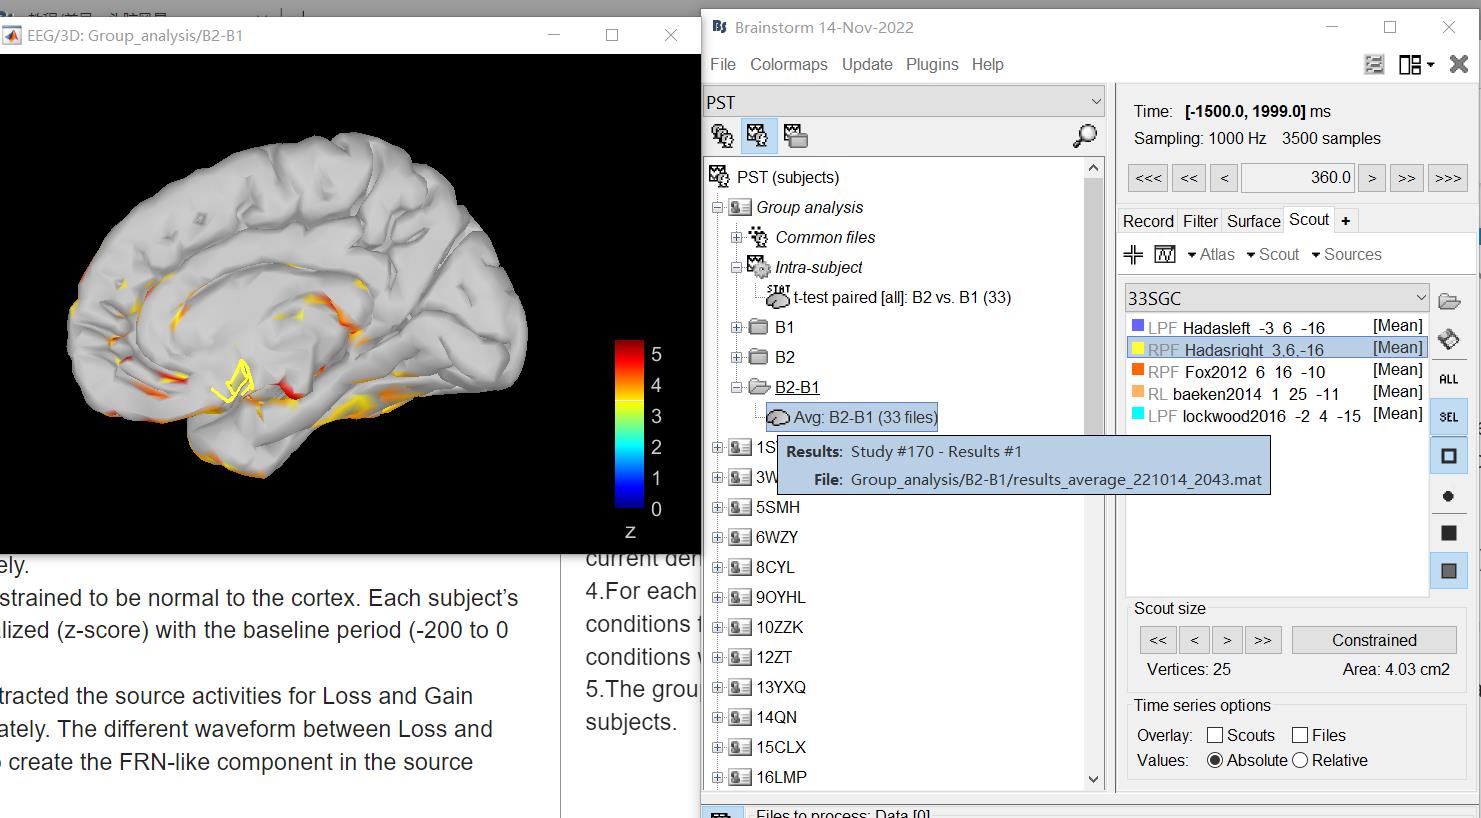
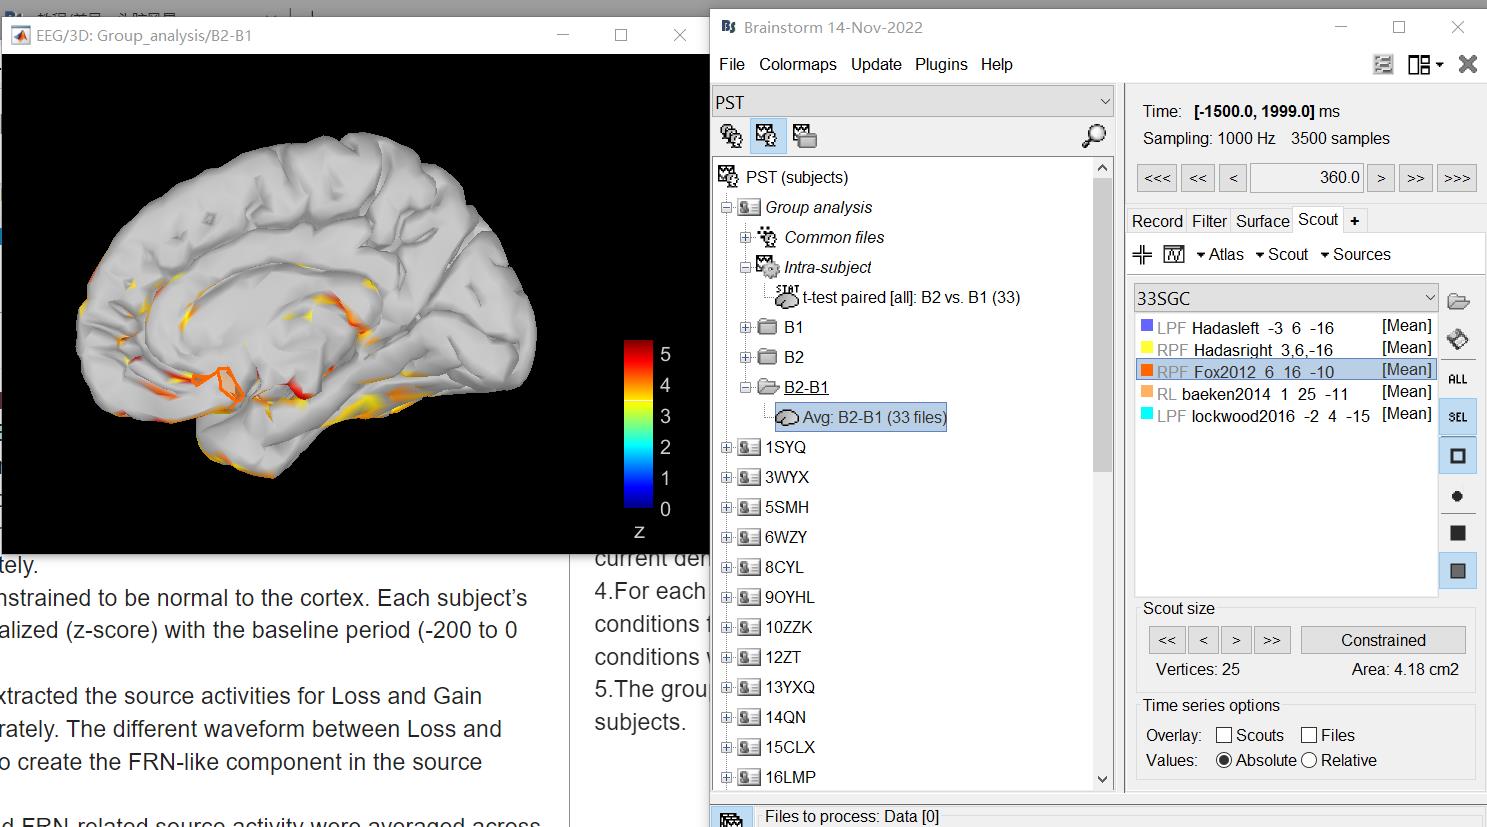
And here are the screenshots of the brain regions in brainstorm:
-
blue location on the right side ('b' picture):
-
red location ('d' picture):