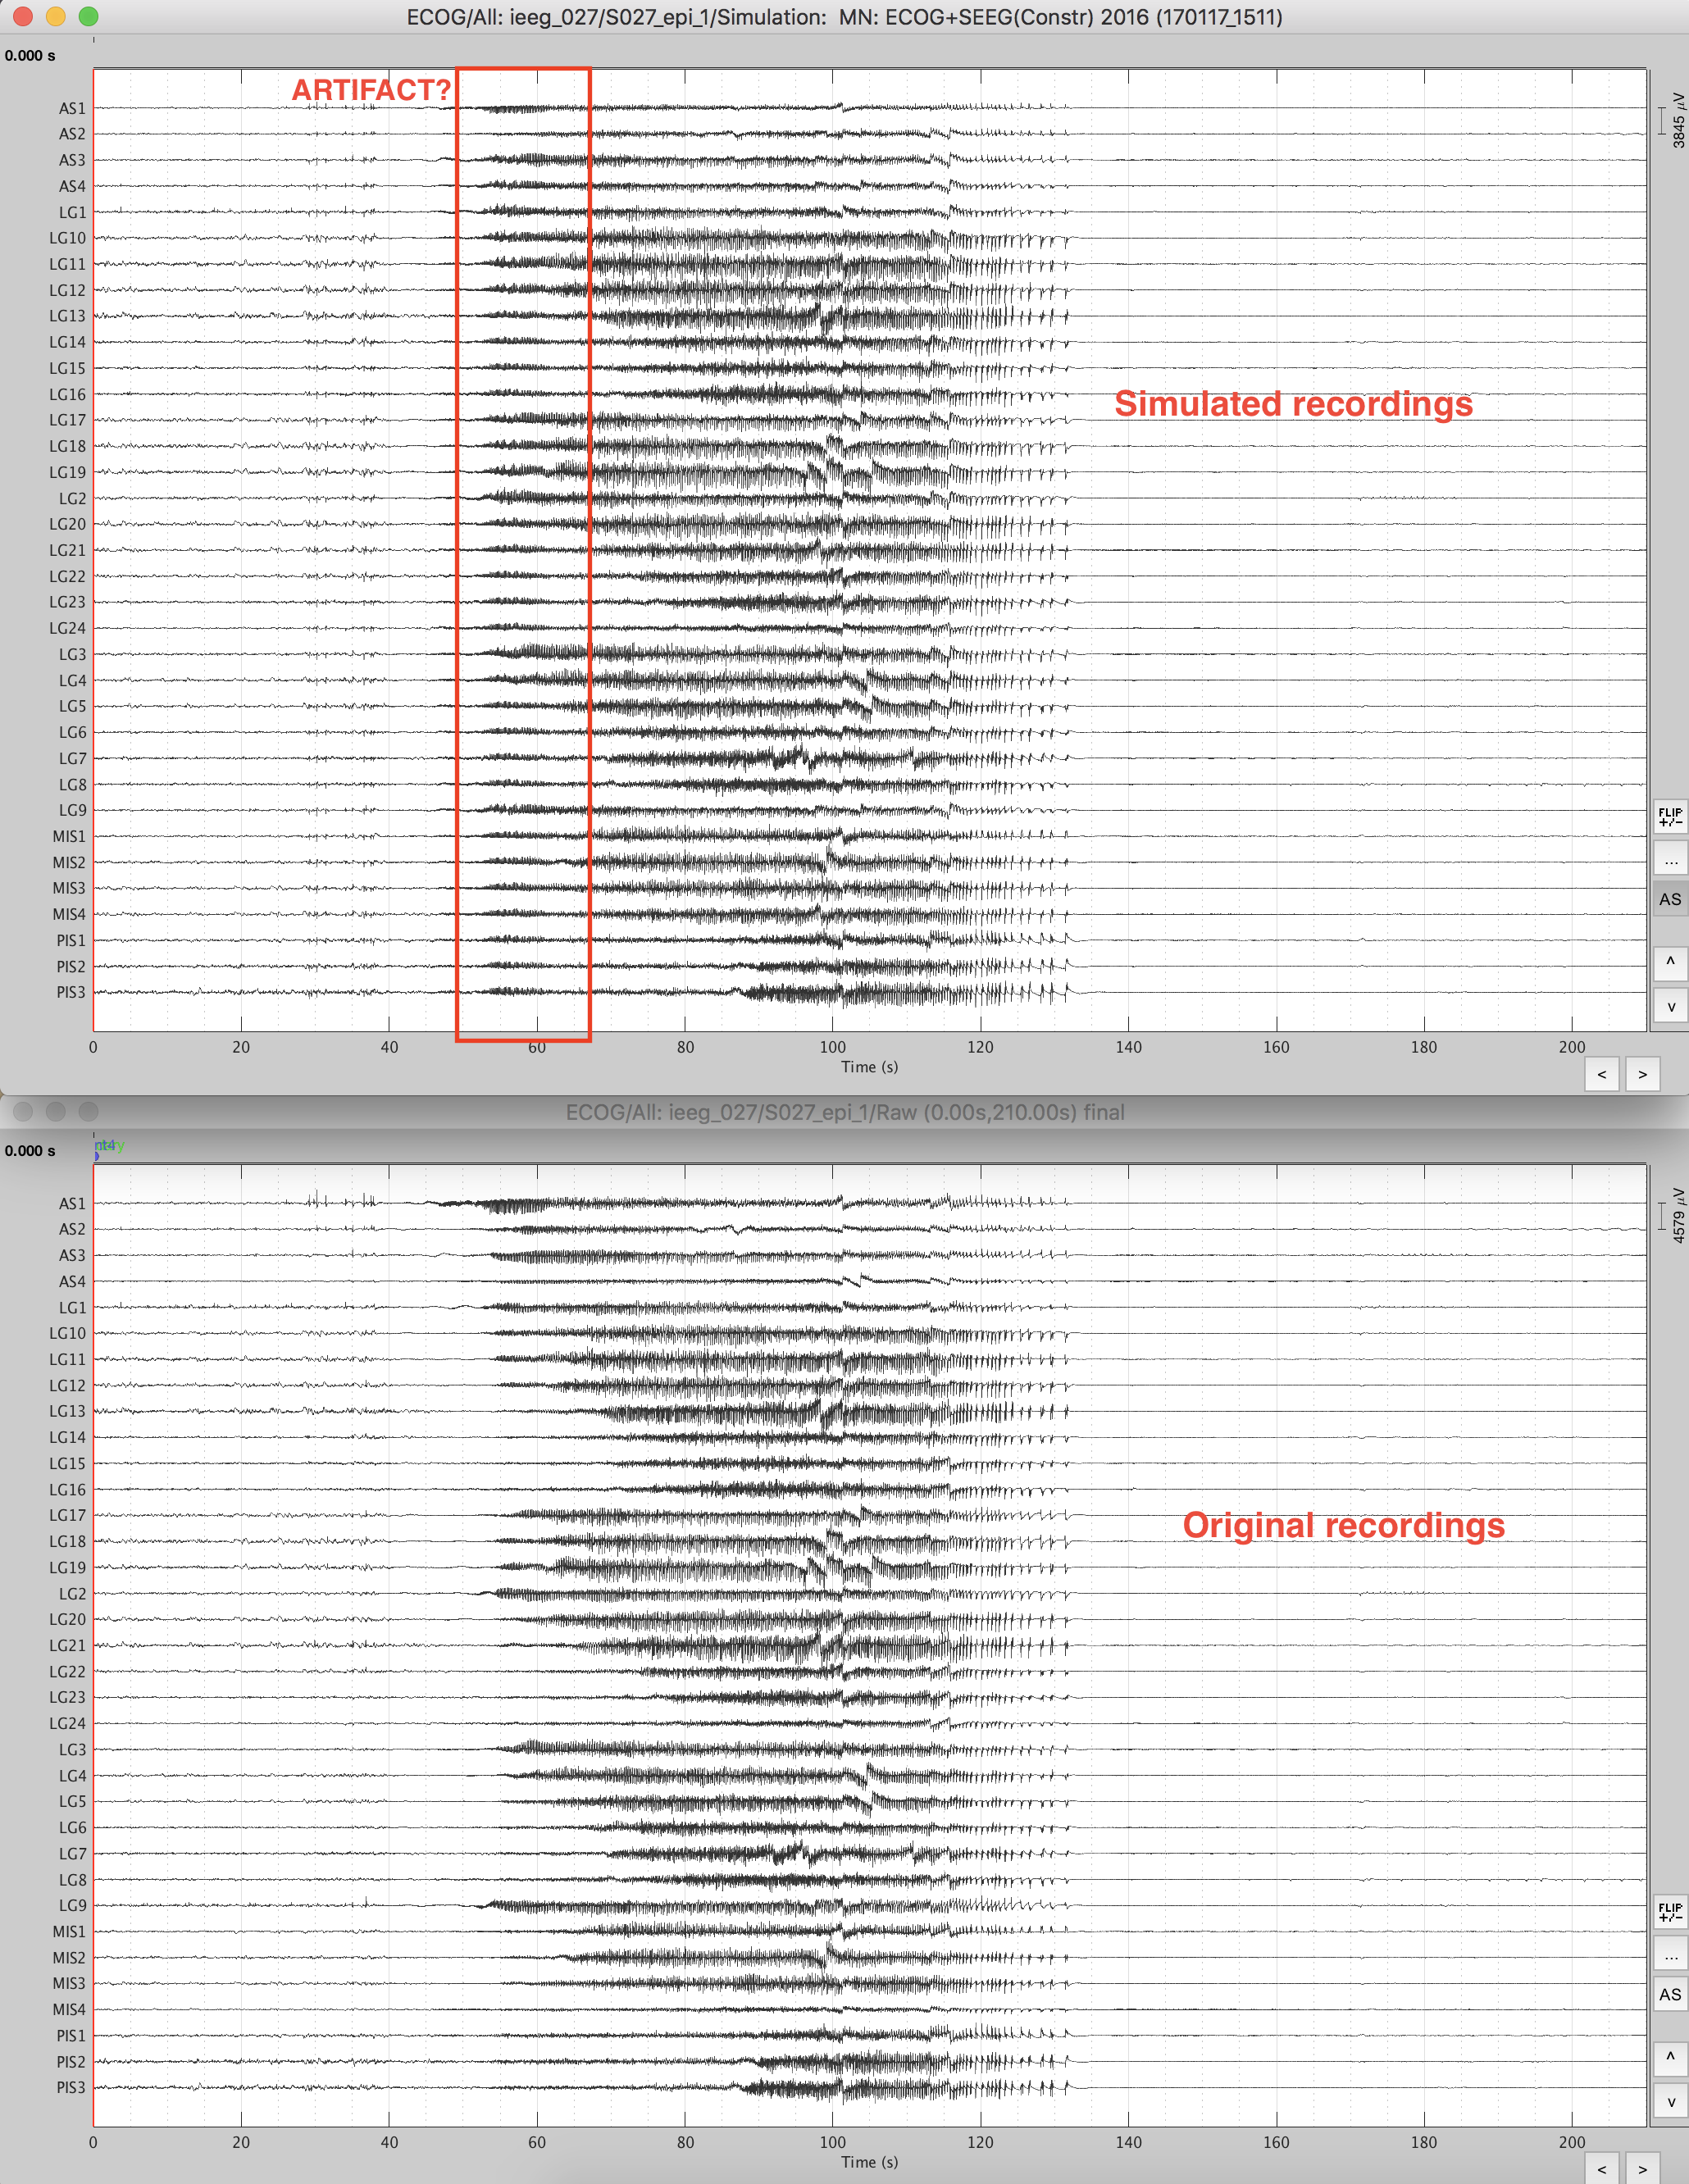
I have been trying to use brainstorm to perform source localization on (epilepsy) intracranial data. For two patients implanted with ECOG and depth electrodes, I computed a BEM head model for 5000 cortical sources locations from their MRI data with scalp, skull and brain (either 1000 or 1400vertices each, default conductivities). I then computed the constrained MNE current density maps with brainstorm's default parameters. In one case the simulated recordings look fairly accurate, but for the second patient the simulated recordings seem to show periods of activity almost identical in all channels and that shouldn't be there, as you can see on the image in the link below.
I suspect that this activity 'spreads' from one of the channels (presumably the first) during the procedure of projection to sources & backprojection to the channels, possibly due to the fact that for a large portion of the brain (that which isn't covered by grids) the reconstructed sources are noisy, to say the least.
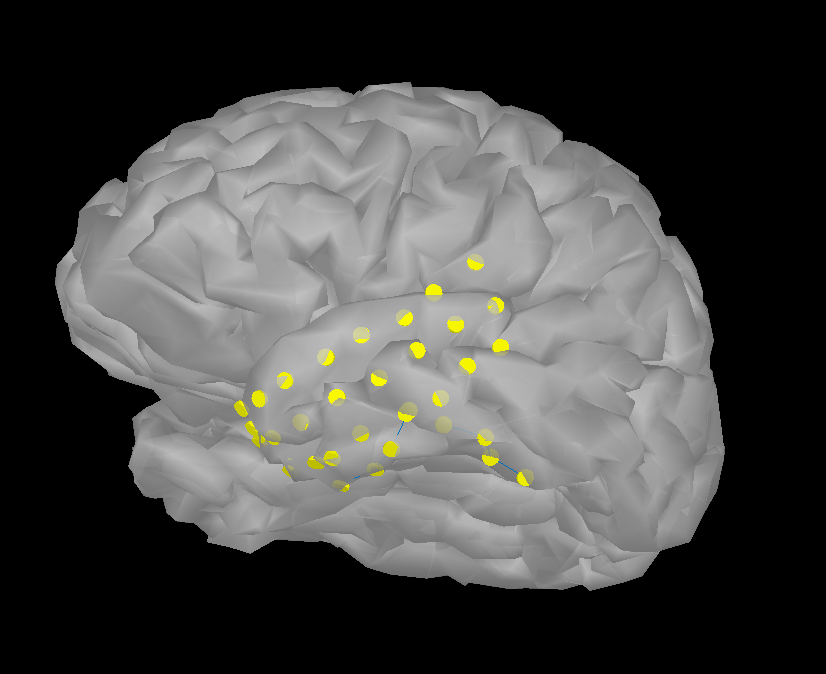
The electrode localisation looks like this:
Do you have any idea what might be causing this issue and if there is any way around? Is it ill-advised to perform source analysis when a large part of the cortex isn't covered with electrodes as is typically the case with ECOG data?
I wanted to compute the sources to be able to estimate activity more reliably in between regions covered by electrodes (and get rid of noise originating from other parts of the brain), but I find from simulations that the further from the electrodes the noisiest the localization (even when the sources are not outside of the region of interest covered by grids but simply in sulci). Therefore, the advantage of performing source analysis rather than simply projecting the channels' activity on the cortex seems quite low.
I would greatly appreciate it if you had any insights on this issue or general advices!
Thank you very much for your help.
Tom Bugnon
Your simulations look quite good. I agree that there is some overall noise boosting that is occurring on all channels at all times. What parameters did you enter for the min norm? The SNR parameter is meant to control the amount of regularization in the imaging kernel. The default is “3”, which may be too high for your needs, so try a smaller number, e.g. “2” and see if that helps the overall noise levels. Lower SNR levels mean more regularization and suppression of the noise in the model, but at the possible expense of some signal as well. However, your present signals all look quite good, so tinker with the SNR setting.
In this posting, you are in the particular case of generating a min norm in order to then resynthesize the recordings, which is to say that in this example you are not examining the sources themselves, but rather using them to regenerate the data. But I am assuming that your next step will be to study the source locations themselves, throughout the source grid you have generated. I think you will find a direct MNE to yield all sorts of spurious looking sources at some distance from this very spatially limited source array. I suggest your next step is to use either the dSPM or sLORETA images, using exactly the same MNE parameters. Both of these images internally generate exactly the same image as the MNE, but then “score” each point in the min norm by the anticipated noise that would also be seen at those points. So you should see a dramatic falloff of noisy looking sources at some distance from your ECoG, since those source points are dominated by noise anyway.
FYI: We improved significantly the tools available in Brainstorm for processing and visualizing SEEG and ECOG data, including new options for volume coregistration. They are now documented in a new tutorial: http://neuroimage.usc.edu/brainstorm/Tutorials/Epileptogenicity