Hi there,
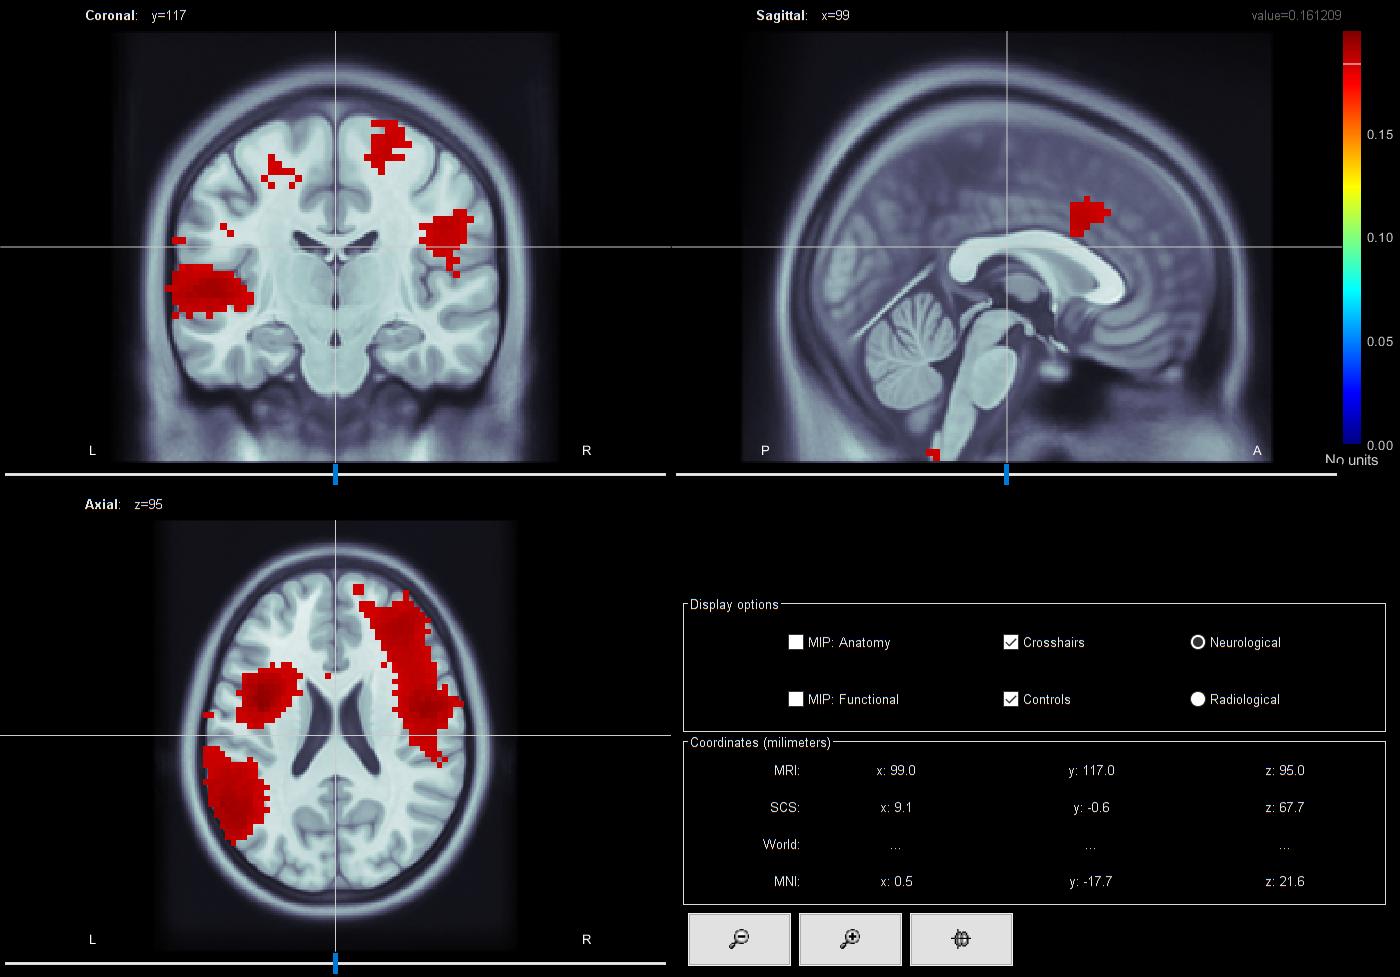
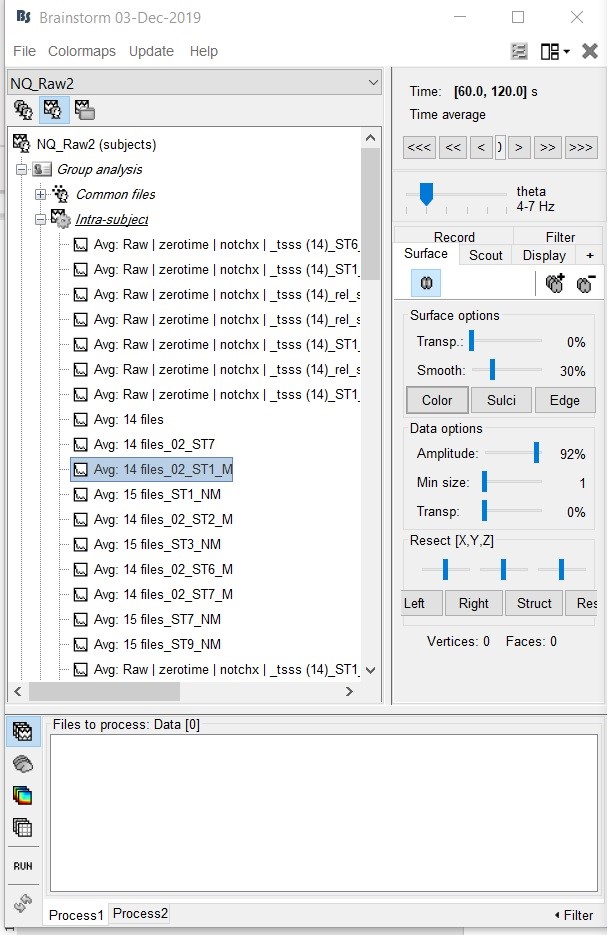
I am using AAL3 scout for MEG (elekta) spontaneous data to analyse brain estimation. My question is as image enclosed, how can I setting the amplitude threshold for visualizing the source estimation?
For your information, I select MRI volume, overlapping spheres, minimum nom imaging, current density map, unconstrainted, diagonal noise covariance
Thank you veruy much for your comments
1 Like
Dear Syairah,
The amplitude threshold can be set with the amplitude slider at Data options in your second screenshot.
Probably this is already known but for a MEG recording, using a diagonal noise covariance is not a good approximation and will hinder your source localization.
Kind regards,
Steven
For your information, I select MRI volume, overlapping spheres, minimum nom imaging, current density map, unconstrainted, diagonal noise covariance
We'd recommend you use:
- a noise covariance matrix computed from noise recordings, as illustrated in the introduction tutorials:
https://neuroimage.usc.edu/brainstorm/Tutorials/NoiseCovariance
- normalized source maps (dSPM, Z-score or sLORETA):
https://neuroimage.usc.edu/brainstorm/Tutorials/SourceEstimation#Standardization_of_source_maps
how can I setting the amplitude threshold for visualizing the source estimation?
The amplitude threshold can be set with the amplitude slider at Data options in your second screenshot.
This will not give you an objective threshold, it is to be used for visual exploration only. For evaluating the significant activity, you should compare two experimental conditions (or an active state vs. a baseline) using non-parametric tests.
If you are not familiar with these concepts, we recommend you start by following all the introduction tutorials using the example dataset provided (section "Get started" of the tutorial page):
https://neuroimage.usc.edu/brainstorm/Tutorials
Hi Francois,
If I were to explore & explain from descriptive point of view before doing the statistical analysis, what is the best recommended amplitude threshold for source estimation? Any readings to refer to would be much appreciated. Thanks in advance.
W
If I were to explore & explain from descriptive point of view before doing the statistical analysis, what is the best recommended amplitude threshold for source estimation?
There is none.
The interactive threshold slider is an arbitrary tool to let you explore the data interactively. As explained in the tutorials, the maximum (100%) is arbitrary and is linked to the colormap used in the figure. Change the colormap, it changes what 100% means. Nothing in there has any mathematical or physical meaning, just like the choice of the color set for your colormap.
The interpretation of the dSPM values are a bit easier (https://neuroimage.usc.edu/brainstorm/Tutorials/SourceEstimation#Source_estimation_options_.5BTODO.5D) but the only way to get reliable thresholds of your source results is to use non-parametric statistical tests.