Dear sir,
I have computed the sources (dSPM, sLORETA) along with relevant scouts for my dataset. But I need to compute the graphical connectivity (node and edges between the scouts), but I found no options under the "connectivity" process in process pipeline editor. Kindly suggest how can I proceed.
Thanks
Debashis
I have created the cortex surface along with scouts. But how to connect the scouts using graphical structure (nodes=scouts, edge=connection strength between two cortexes)?.
Please give your valuable response.
Dear Debashis,
If you have scouts signals available in your database, you can select them in the Process1 or Process2 tabs and compute connectivity measures between them. The NxN connectivity matrices can be displayed as connectivity graphs or images.
I'm not sure I understand what you mean with "compute the graphical connectivity". Can you please try to explain better what you are expecting to obtain? Are you asking for help to get a specific type of display, or a specific type of connectivity measure? Which measure are you using?
Maybe post a few screen captures or images of what you want to obtain.
Thanks
Francois
Thanks for your response.
I want to get the binary functional connectivity (please check the image file ) between nodes, where the nodes are scouts,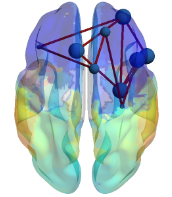 and edges are represented as 1/0 (based on the selection of correlation threshold).
Dear Sir,
I have implemented the scouts level connectivity (based on correlation) from two process windows, but there is no options of graphical connectivity in "Run process->connectivity". For the same reason, I cannot measure the local and global measures of the graph. Please help me out.
Thanks
Debashis
I want to get the binary functional connectivity (please check the image file ) between nodes
Unfortunately, the type of graphic display you want is not available in Brainstorm.
You can only display the connectivity graphs as matrices (=images) or as graphs. You can refer to the tutorial draft we have online for examples (not finished yet):
https://neuroimage.usc.edu/brainstorm/Tutorials/Connectivity
You can read the connectivity values computed from Brainstorm in Matlab and use your own code or other toolboxes for rendering the graph in a different way.
See the last section of the tutorial for help with the data storage:
https://neuroimage.usc.edu/brainstorm/Tutorials/Connectivity#Additional_documentation
For the same reason, I cannot measure the local and global measures of the graph
You have easily access to the connectivity graph from Matlab, therefore you can compute all the measures you need from it from your own scripts.