I have a question about the display and file contents of my obtained source models.
I have a dSPM source model that is time averaged (and after that normalised). This way I have one dSPM model for one measurement. I can display the source model on the cortex of the brain or on the spheres perfectly.
For further analysis I was hoping to get 2D projections of the source model. Sort of like 'unfolding' the cortex and displaying it as a flat surface (so that the z-coordinates of every point is zero). Is this possible in Brainstorm?
Moreover, I had a question about the output files. In my case the ImageGridAmp field is 15002 x 2. Which makes sense, since I chose to use 15000 vertices. If I want to use this data file to get to a 2D representation/image of the source model on the cortex, how do I know which value goes in which location?
For further analysis I was hoping to get 2D projections of the source model. Sort of like 'unfolding' the cortex and displaying it as a flat surface (so that the z-coordinates of every point is zero). Is this possible in Brainstorm?
No, this is not something that you can do with Brainstorm.
If you have Matlab code to flatten the cortex surface, you could hack it in though: edit the cortex surface you used to compute the sources (right-click > File > Export to Matlab), replace the Vertices matrix with the flattened vertices, and import it back to the database (and never re-use this surface to compute new inverse models).
If you manage to do this, please share, this would be an interesting feature to add to Brainstorm.
Moreover, I had a question about the output files. In my case the ImageGridAmp field is 15002 x 2. Which makes sense, since I chose to use 15000 vertices. If I want to use this data file to get to a 2D representation/image of the source model on the cortex, how do I know which value goes in which location?
Thank you for the answer, I will let you know I manage to do it.
When I for example have the dSPM model, I can choose cortical activations --> display on spheres/squares. I was wondering if the code for this display function is available, because it might help me understand about the possibilities in the data display.
All code is available, everything is open source and in Matlab scripts.
However, a lot of the display functions are tightly linked to the database management and the rest of the interface, so the code is difficult to extract and reuse without having Brainstorm running in the background.
The top-level function is view_surface_sphere.m, then you can follow in the code what are all the subfunctions that are called (many layers...)
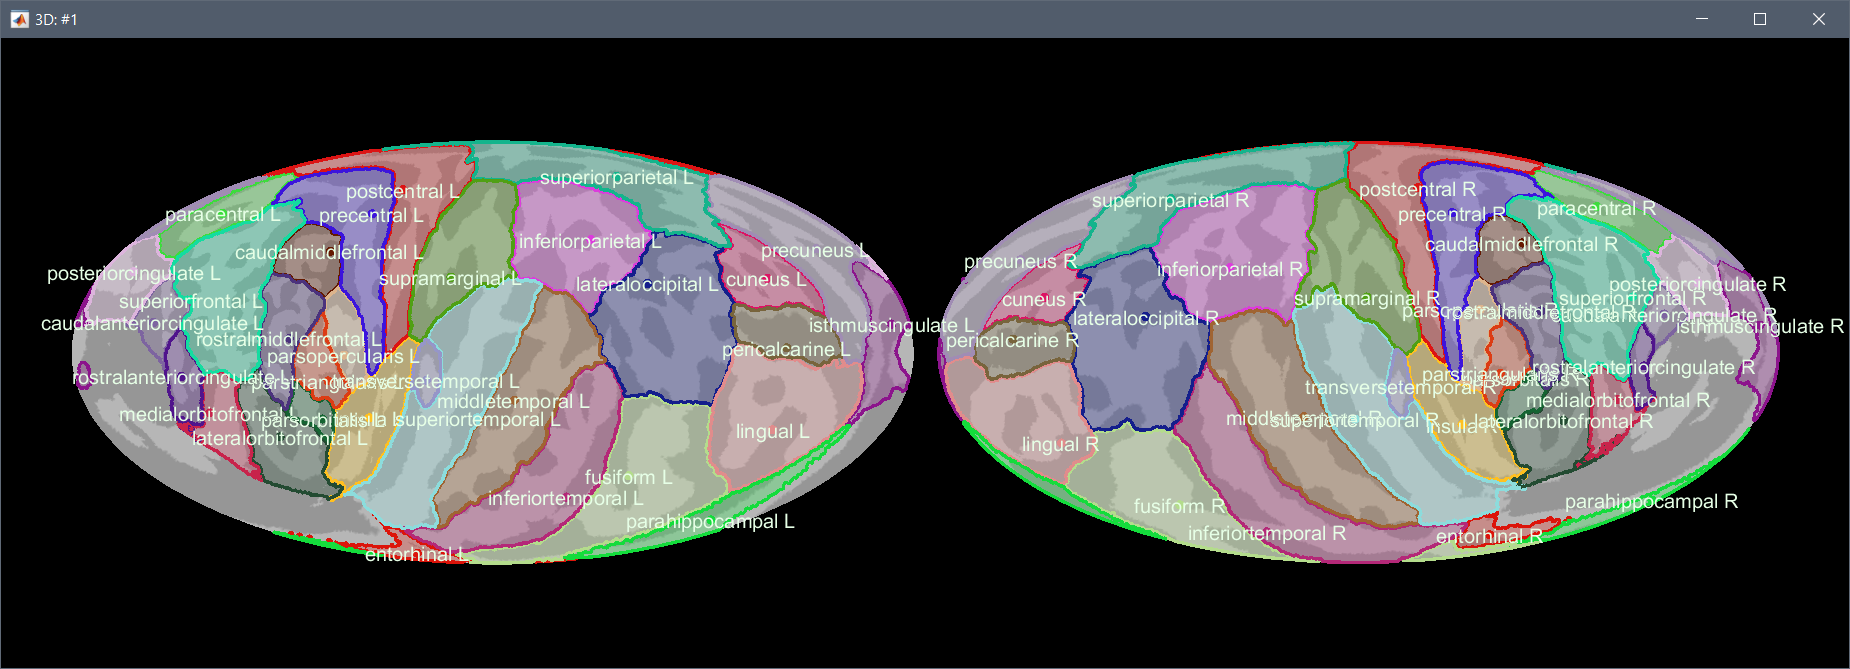
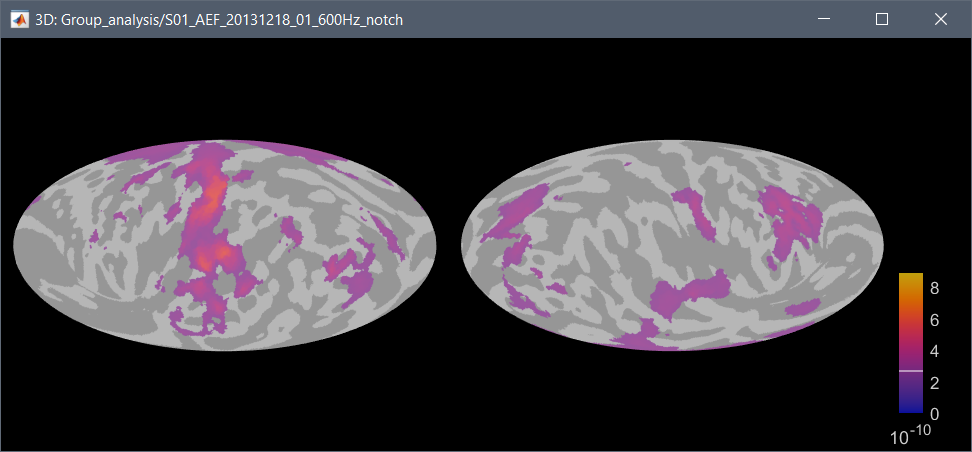
I managed to get a 2D projection of the 3D source images of the cortex. I did it using Mollweide projection just like they did in this paper: Hemispherically-Unified Surface Maps of Human Cerebral Cortex: Reliability and Hemispheric Asymmetries - PMC.
I used the vertex coordinates from the anatomy data and the corresponding values from the functional data. I also added this functionality for projection scouts onto the 2D surface.
I wrote the following functions to do it:
flatten_source: the main function that generates the 2D images of the two hemispheres and gets the 2D coordinates of the scouts.
Mollweide_proj: function that projects latitude and longitude coordinates (spherical coordinates) to the xy coordinates of a 2D Mollweide projection.
add_convhull: this function can get the coordinates of a convex hull for the scouts, which can be useful for visualisation
tess_hemisplit: function already available in brainstorm to get the indices of the right and left hemisphere coordinates
I am aware that the functions are written for the purpose I needed them for, so if you have any questions let me know.
This great, thanks for sharing!
Unfortunately, I'm not sure when I would have time to work on integrating this. I added it to my todo list (https://neuroimage.usc.edu/brainstorm/Next#Source_modeling), but as you can see, it's already quite long
Would you be interested in going one step further and adding it to the interface of Brainstorm?
Writing a function similar to view_surface_sphere.m (or simply adding an input parameter to it) and add an entry to tree_callbacks.m to call it?
If you do, please post your contribution directly on github as a new pull request.
Here are the files where I changed the code to be more like view_surface_sphere (view_surface_2dprojection). I also altered tree_callbacks and added the mollweide projection function, which calculates the new vertex coordinates in 2D. The flatten_source code is extra code which makes an image out of the 2D projection by interpolating it on a uniform grid.
Any possibility that this 2D visualization could be added to time-frequency source maps? It would be a huge help. Also, simulate recordings does not work with source-level time-frequency files. (I thought I might use that to access the 2D topo maps, but to no avail). Thank you very much!