Have you tried recently the Deep Brain Atlas tutorial?
It seem is not working anymore
I followed all the steps in the tutorial but deep brain structures are ignored and there is no color change on that
I also tried computing frequency (welch) but results are the same,
This never happened to me before, I think it has something to do with the last brainstorm updates.
update: I tried once more with a new protocol, other subject and a smaller EEG file that used to work fine with tu DBA tutorial, but no, the result is just the same
Although the cortex and the deepbrain structures are surfaces, their sources are not necessarily only in the surface, this is the source space used in the tutorial for the structures:
Cortex and hippocampus: Surface sources
Amygdala and thalamus: Volume sources
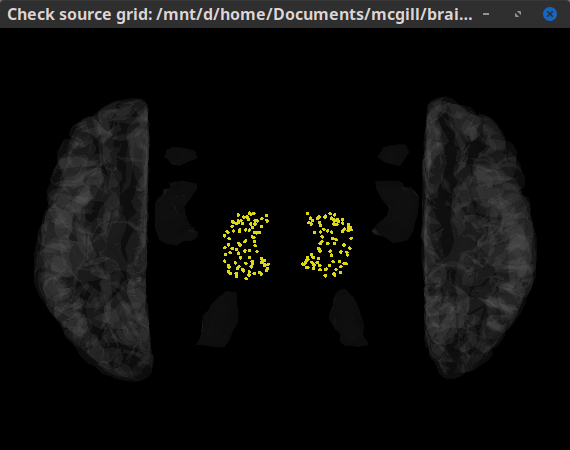
You can verify this on the head model by right-click then Check source grid (volume) (left image) and Check source grid (surface) (right image)
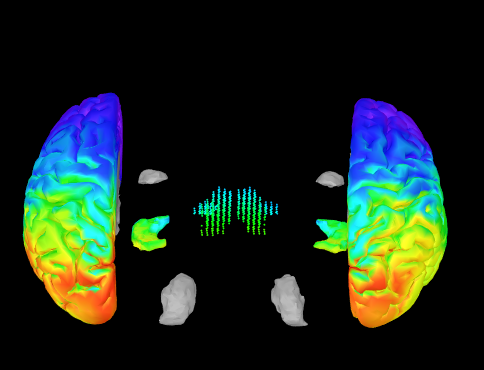
When displaying sources. Surfaces for amygdala and thalamus seem empty as source activity is not shown on them. This happens as theirs sources are volume sources, so the activity is displayed as grid points in those structures. The figure below shows this, only left hemisphere is shown, and scouts were created to add colors to the deepbrain structures. The amygdala and thalamus surfaces contain source in a volume grid.
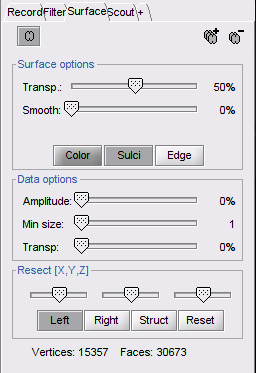
Now, when the Struct option is selected, the Surfaces are separated for visualization, but their volume sources are not. So, amygdala and thalamus surfaces are gray, but their sources present values:
Hi!
Thank you for your prompt reply, but I'm afraid it's not my case. Usually structures made of dots also change their colors, which was my previous experience, but as you can see now the dots stays blue no matter what, even in the example image you shared here. I have tried it even with old datasets that used to work fine (I mean the points had colors other than blue) but no, they don't work anymore (when I recomputed them).
I wasn't referring to the structures in gray, as I know those don't change color because they are volume type.
Thanks for the clarification. I ran a sanity test, and things seem to be working fine.
MEG recordings for one trial were simulated using an unconstrained signal in the middle of the left amygdala. Noise was added with default level in the sensor and source level. See: https://neuroimage.usc.edu/brainstorm/Tutorials/Simulations
Using the same anatomy as in the deep brain tutorial and the same mixed head model, sources were estimated from these simulated recordings.
For subcortical structures, as expected higher activity is observed on the left amygdala. Since MN is biased towards superficial sources, high activity on the cortex above the simulated source is observed.
Top left: Left amygdala surface on MRI
Top right: Simulated sources
Bottom left: Estimated sources MN with mixed headmodel (3D visualization)
Bottom right: Estimated sources MN with mixed headmodel
* The crosshair is at the same position in all the MRI viewer figures.
Thank you very much indeed!
I was able to solve it with your help:
the problem was how the map was scaled,
plus I was using absolute power instead of relative, in relative power it looks much better!
Thanks for taking the time to try this. I'm really sorry as it was not my intention to put you guys to work.
Regarding the minimum norm bias: yes, that's exactly why I want to bribe you to include the (weighted) wSloreta so that the results can be better appreciated. Please!!
It is possible to get similar results using current density maps (MN imaging) if the results are normalized, for example with z-score.
One advantage of using these non-normalized maps, is they can be used to reconstruct the MEG/EEG sensor time series, thing that is not possible with already standardized maps (dSPM and LORETA):
The similarity among normalized MN, dSPM and LORETA is showed in this link.
Moreover, recommendations on when to use each method is also provided in that section.