Hello Team Brainstorm,
Any way how to get t-values for a PSD comparison between subjects or groups? I have tried but to no avail. In essence: similar to resting-state comparison of the OMEGA tutorial (bottom of http://neuroimage.usc.edu/brainstorm/Tutorials/RestingOmega), but I would need stats, not just the average difference.
Cheers, Tomas
2 Likes
Hi Thomas,
Yes, you can run statistical tests on the PSD values between groups of subjects.
You have to use a test appropriate for the type of data your are testing.
You can explore the tutorials “statistics” and “workflow” from the tutorials page.
Francois
Hi @tomasros,
I'm currently in the same boat as you were. I have a resting state MEG dataset with 2 groups, and would like to compute power differences (statistically significant differences) just as you were interested in. I followed the resting omega tutorial, and dragged my TF files to the process2 tab to run several statistical tests, and would either get "You are testing power values, while a more standard analysis is to test the magnitude (ie. sqrt(power)). Option #1: Recompute the time-frequency maps using the option "Measure: Magnitude". Option #2: Run the process "Extract > Measure from complex values", with option "Magntiude"." or some null values regardless of whether I used parametric or non-parametric tests.
What I ended up doing was what @Francois recommended in this post: What should be compared in statisctics? - #4 by Francois.
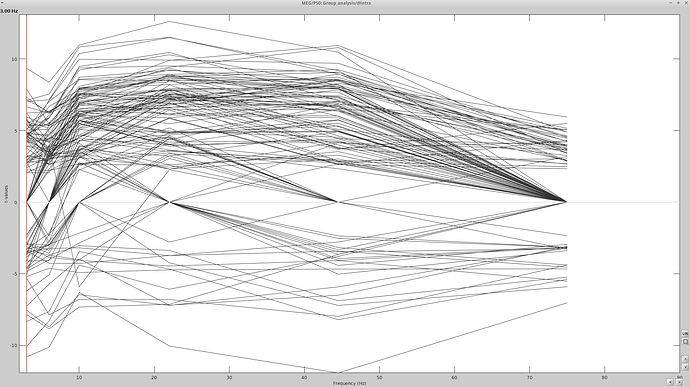
I imported my recordings to the database (5 - 175s) and split into 36 blocks of 5 seconds each. I then computed the PSD (sliding window of 0.5s, 50% overlap, grouped into Frequency bands) for each of the 36 raw 5 second files per subject. Then in the process2 tab, I placed the PSD files for one group in file A and the PSD files for the other groups in file B and calculated the parametric student T-test. I got the following graph:
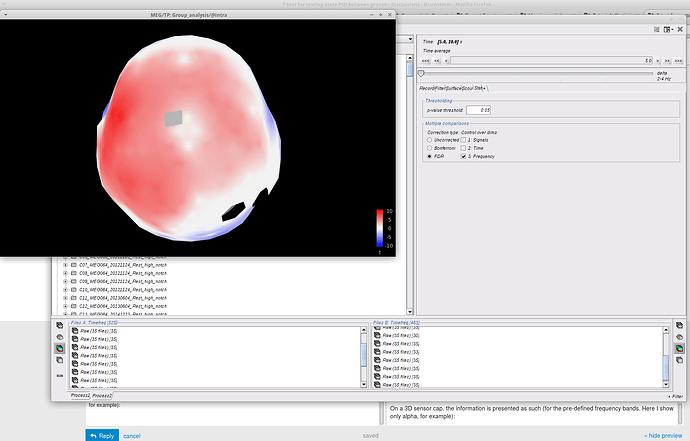
On a 3D sensor cap, the information is presented as such (for the pre-defined frequency bands. Here I show only delta, for example):
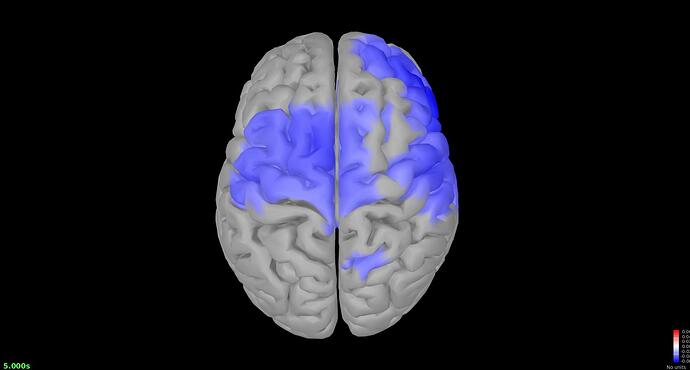
This seems like an improvement from previous attempts to get a test statistic using the method in the Omega tutorial, except it doesn't parallel the Difference I ran using the tutorial's method (compute the TF decomposition, and run a Difference). Here is the file I have for delta:
Obviously there is something wrong with what I did since the calculated Power differences are different for the 2 methods used. If you figured out your resting state analyses on your end, do you mind sharing how you bypassed this ordeal and calculated t-values for your PSD comparison between groups?
Best,
Aquila.
Hi Aquila,
I imported my recordings to the database (5 - 175s) and split into 36 blocks of 5 seconds each. I then computed the PSD (sliding window of 0.5s, 50% overlap, grouped into Frequency bands) for each of the 36 raw 5 second files per subject.
Why don't you simply run the PSD computation on the continuous file?
This seems like an improvement from previous attempts to get a test statistic using the method in the Omega tutorial, except it doesn't parallel the Difference I ran using the tutorial's method
You should compare comparable things: either everything in sensor space or everything in source space.


