When I generate the source images based on Minimum Norm or sLORETA and then plot the scout time series, I saw the physical unit of sLORETA there. I recall sLORETA takes some sort of normalization and present the data in F distribution value in Curry 8. Can you please advise how I can interpret the physical units shown in the figure? Can we trust the physical meaning of pA.m for sLORETA?
How did you manage to produce these figures? and the files that are displayed here?
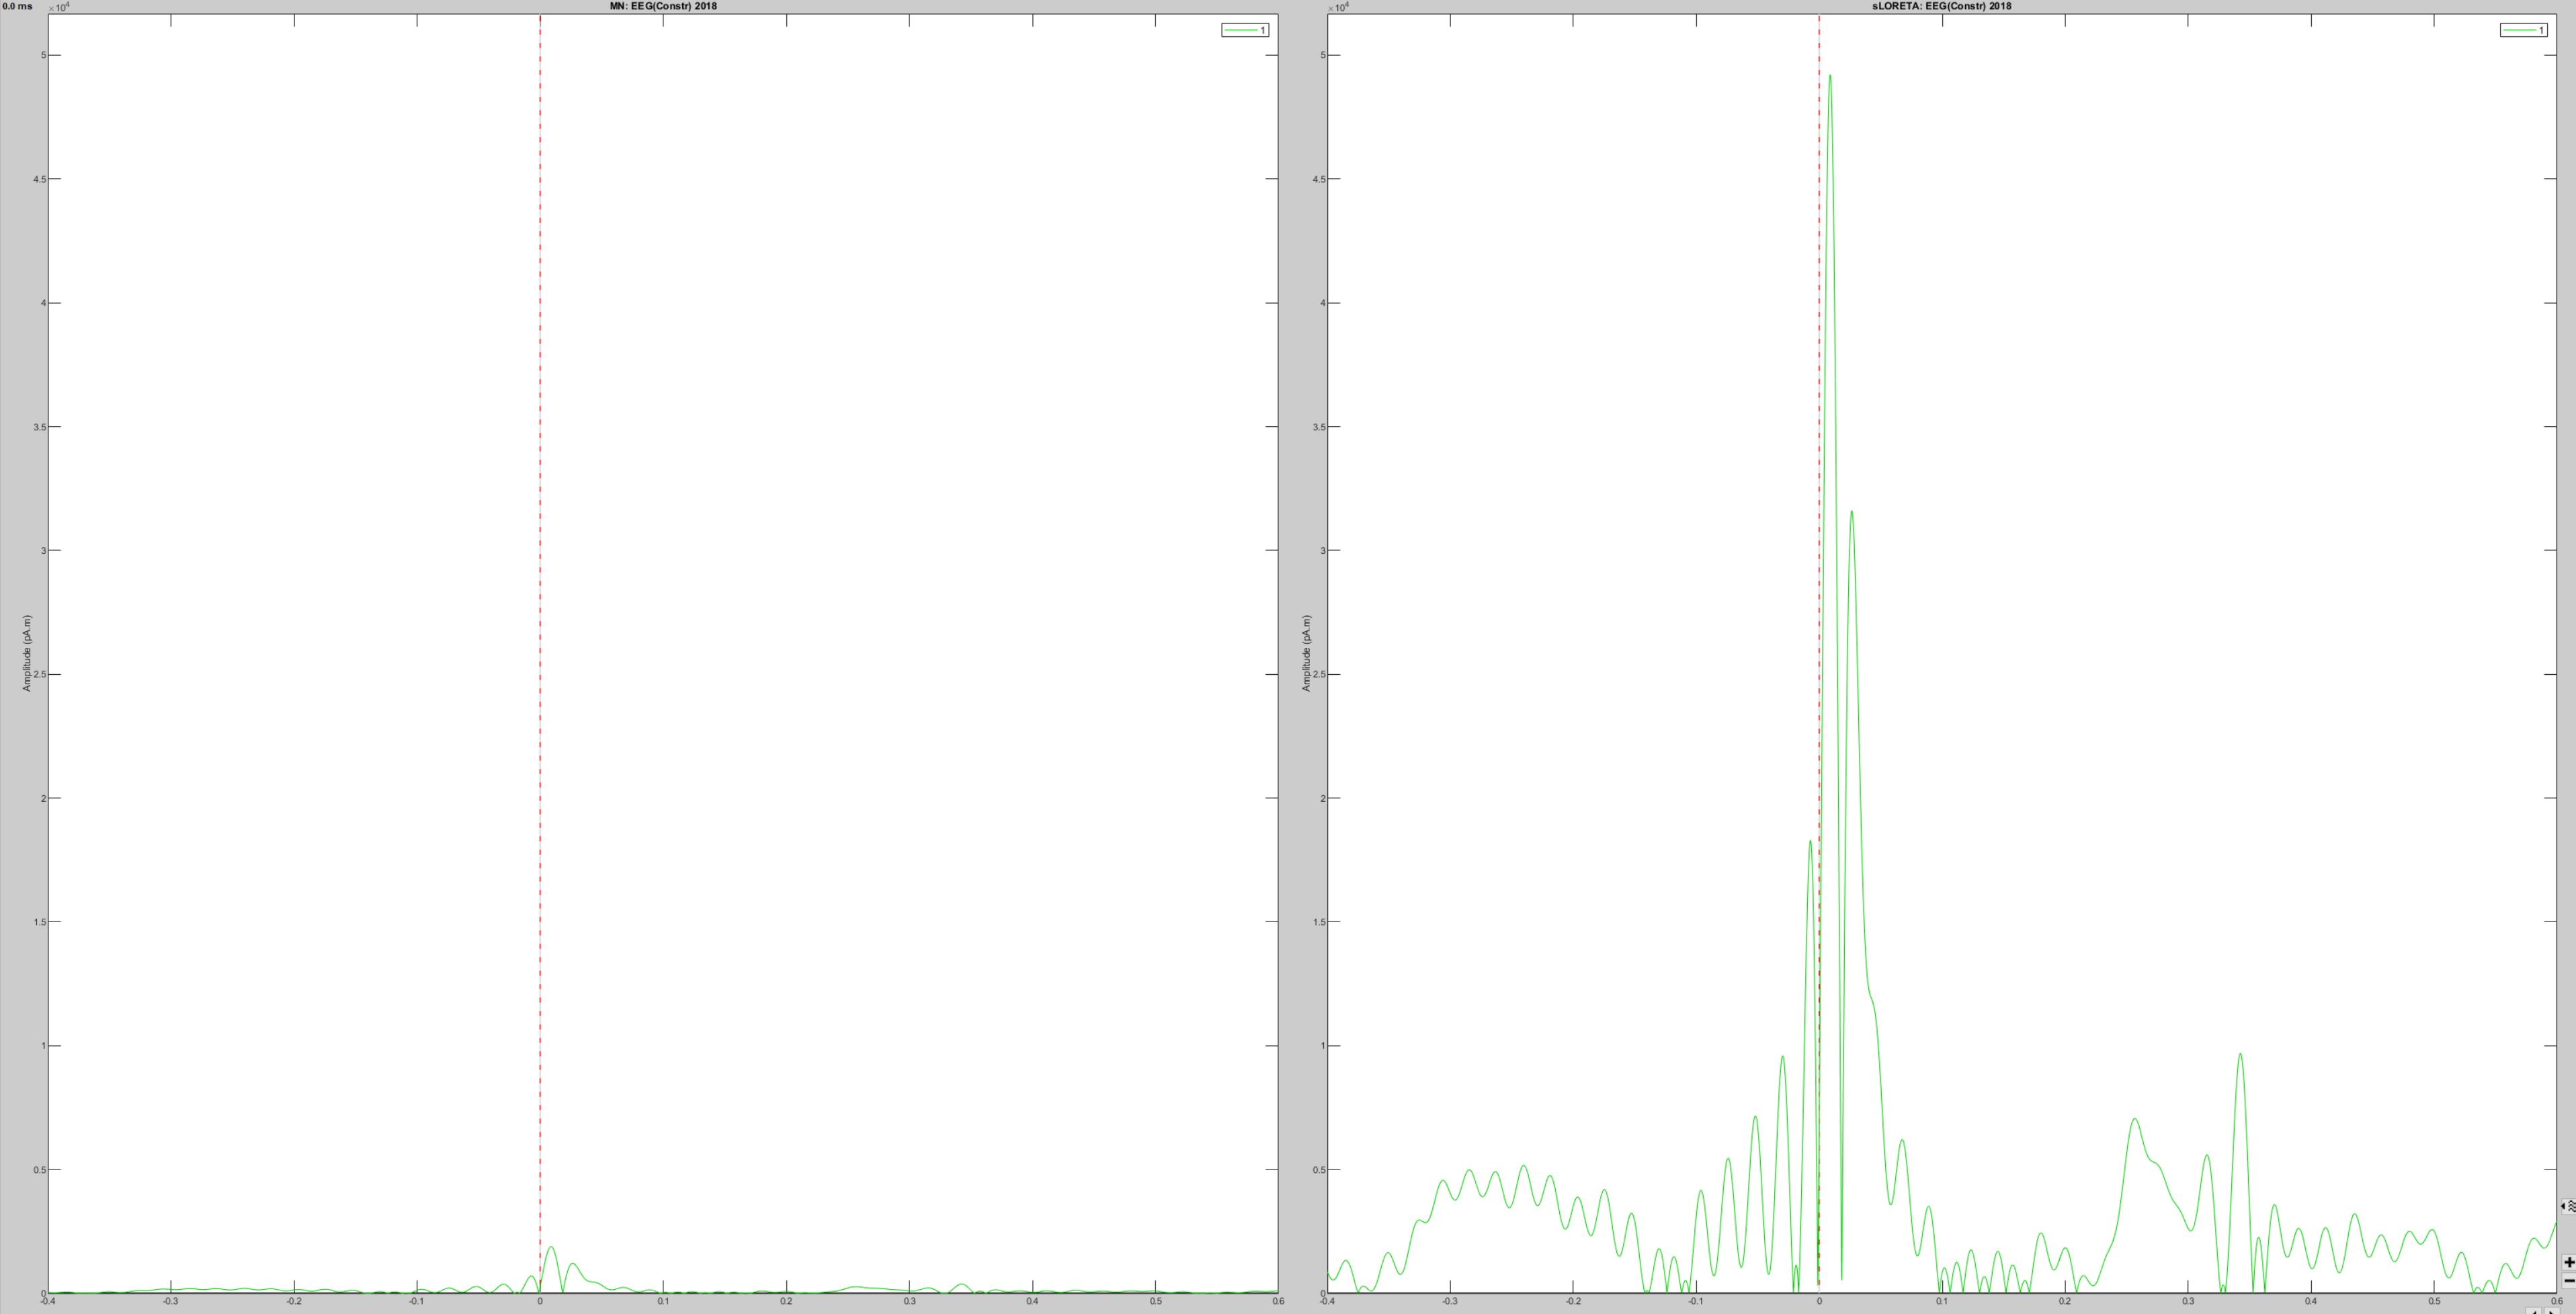
If you plot scouts from sLORETA results, it should not display any units...
I opened the two sLORETA source results from two different experimental conditions.And then I selected the Scout, and then clicked on the plot button. It then gave the results as I attached. I did generate the MN results as well, but not opened the results at the same time as the sLORETA results.
By the way, how can I do statistical analyses for the scout results? How can I save the scout line profiles as an intermediate results in the tree structure and then do testing by selecting the results from there?
By the way, how can I do statistical analyses for the scout results? How can I save the scout line profiles as an intermediate results in the tree structure and then do testing by selecting the results from there?
You can either select the sources results in the Process2 tab and select the scouts you are interested in in the options, or you can first save the scouts time series with the process "Extract > Scouts time series" and then run the tests on the files it creates.
Hi @Francois
When I compute MNE with my own script, with gain matrix and signals exported from Bst, the order range of the scout time series is 10^-10! I'm wondering if I should to change the units of exported data?
Regards
For current density maps, you get Amper.meters saved in the files, and in the range of pA.m (10^-12).
For sLORETA, you get unitless values, and I think 10^-10 is an acceptable range.