We have been using Brainstorm for a while and finally have our experiment done. However, there is some uncertainty about our research result. We have looked up possible solutions on the forum but this did not help, so here are some questions:
-
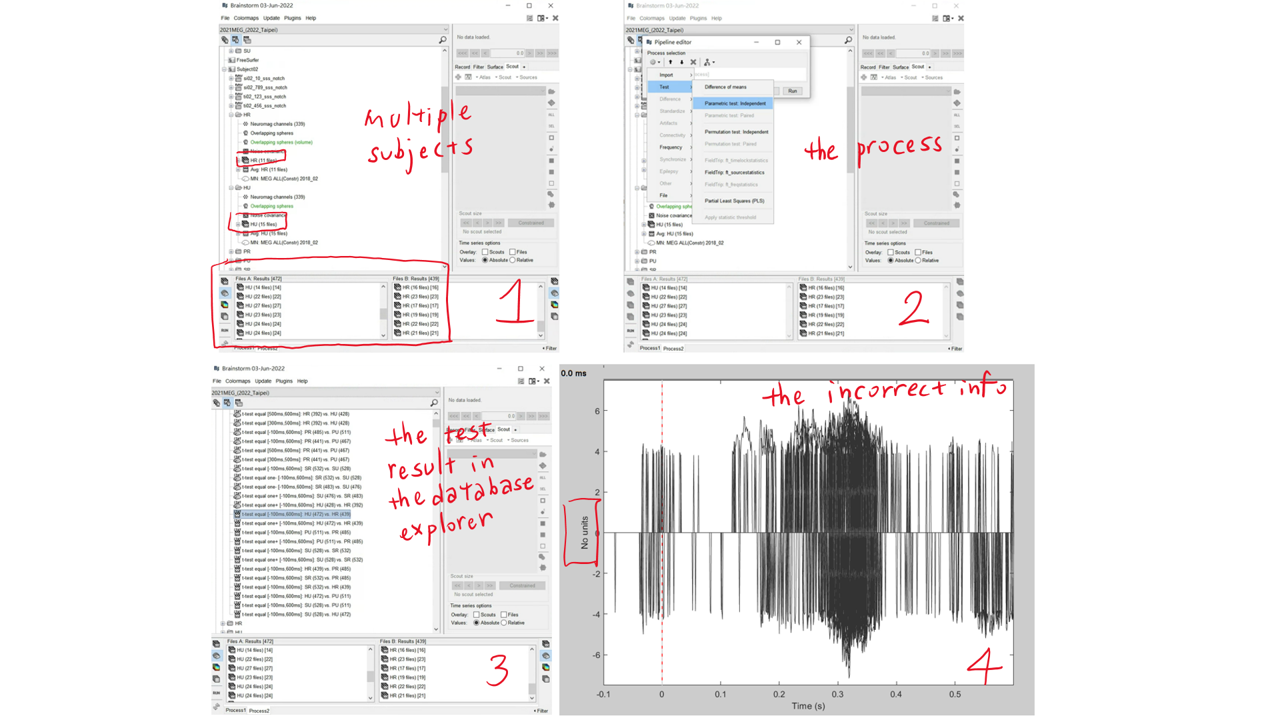
According to the online tutorial (Tutorial 26: Statistics), the results of Examples 1 and 4 have different units on their y-axis. Example 1 is labeled "t-values" and example 4 as "amplitude (pA.m)", but in our result, the unit is displayed as either "fT" or "no units." We would like to know the possible reasons and how to fix this problem (except for clicking on the unit and changing the label of the y-axis directly.)
-
We would like to confirm if "the unit" (the label of the y-axis) represents “t-values” when the difference between two conditions is significant.
The related figures are attached below, thank you in advance!