Hi -
We have computed FFTs (grouped by frequency band) on source data then computed the difference in averages between conditions, computed t-tests between conditions, and then applied the statistic threshold to the difference file. When we display the stat corrected source data (i.e., the difference file with stats applied) on the MRI, we want to customize the threshold for consistent display and comparison across conditions, but how do we know what threshold value is statistically significant? When we change the maximum custom values for display, it obviously changes the size of the activation areas, but there don’t seem to be any limits to the threshold values linked to our statistics. I checked the t-test stats file, but the scale bar says “Invalid scale” or includes the range of t-values. Where can I find the threshold values for the frequency bands in the source files that correspond to my stats criterion (i.e. p<0.05)?
Thanks,
Ann
Hi Ann,
If your file is a Brainstorm stat file obtained with a parametric or non-parametric test, it should show it in the icon of the file and you should get the panel “Stat” that appears when you load the file. This panel should let you change your p-value threshold, the “Amplitude threshold” in the stat file should be disabled, and changing the colormap maximum should not affect the “significant values”.
If you compute a difference instead of a test, nothing of this is true, and the file behaves as you describe.
I’m not sure I understand what you did in order to get this file.
Could you please post screen captures illustrating where the file is in your database explorer, from which files it was computed, how, and what it looks like when it is displayed?
Thanks
Francois
Hi Francois,
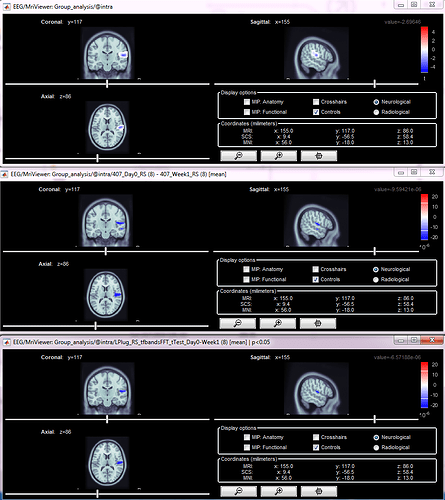
Thanks for your response! I first computed the difference between two conditions (same group of subjects), second I computed the t-test, then I applied the t-test to the difference file (see screenshot). The resulting images are shown below (stat file, difference file, stat applied to difference) - I have set them all to the same MNI coordinates and the same frequency band and have not adjusted the amplitude thresholds. My question is whether I can set an amplitude threshold on the last image (stat applied to difference) that will only show the regions that are statistically significant in the difference file, and if so, how do I find that amplitude threshold? Is it in the stat file itself? In this example, the last two files do not look too different, but in others, the difference is more substantial. Plus, if I change the amplitude threshold for visualization, I can make many regions appear to be significant! I hope this makes sense.
Thanks!
Ann
I get it, you are doing what is illustrated in the Statistics tutorial, right?
https://neuroimage.usc.edu/brainstorm/Tutorials/Statistics#Directionality:_Difference_of_absolute_values
Once you compute this file, you should absolutely keep the amplitude threshold at 0% in the Surface tab.
The maps are already thresholded, you should not apply additional random amplitude threshold.
I added a note in the tutorials about this.
Yes, we were following the tutorial. Thank you for that clarification. We will leave the files alone!
Thanks again!
Ann

