Hello,
I am currently doing some time-frequency analysis and realized something peculiar. Not sure if it is a bug or just a misunderstanding on my part.
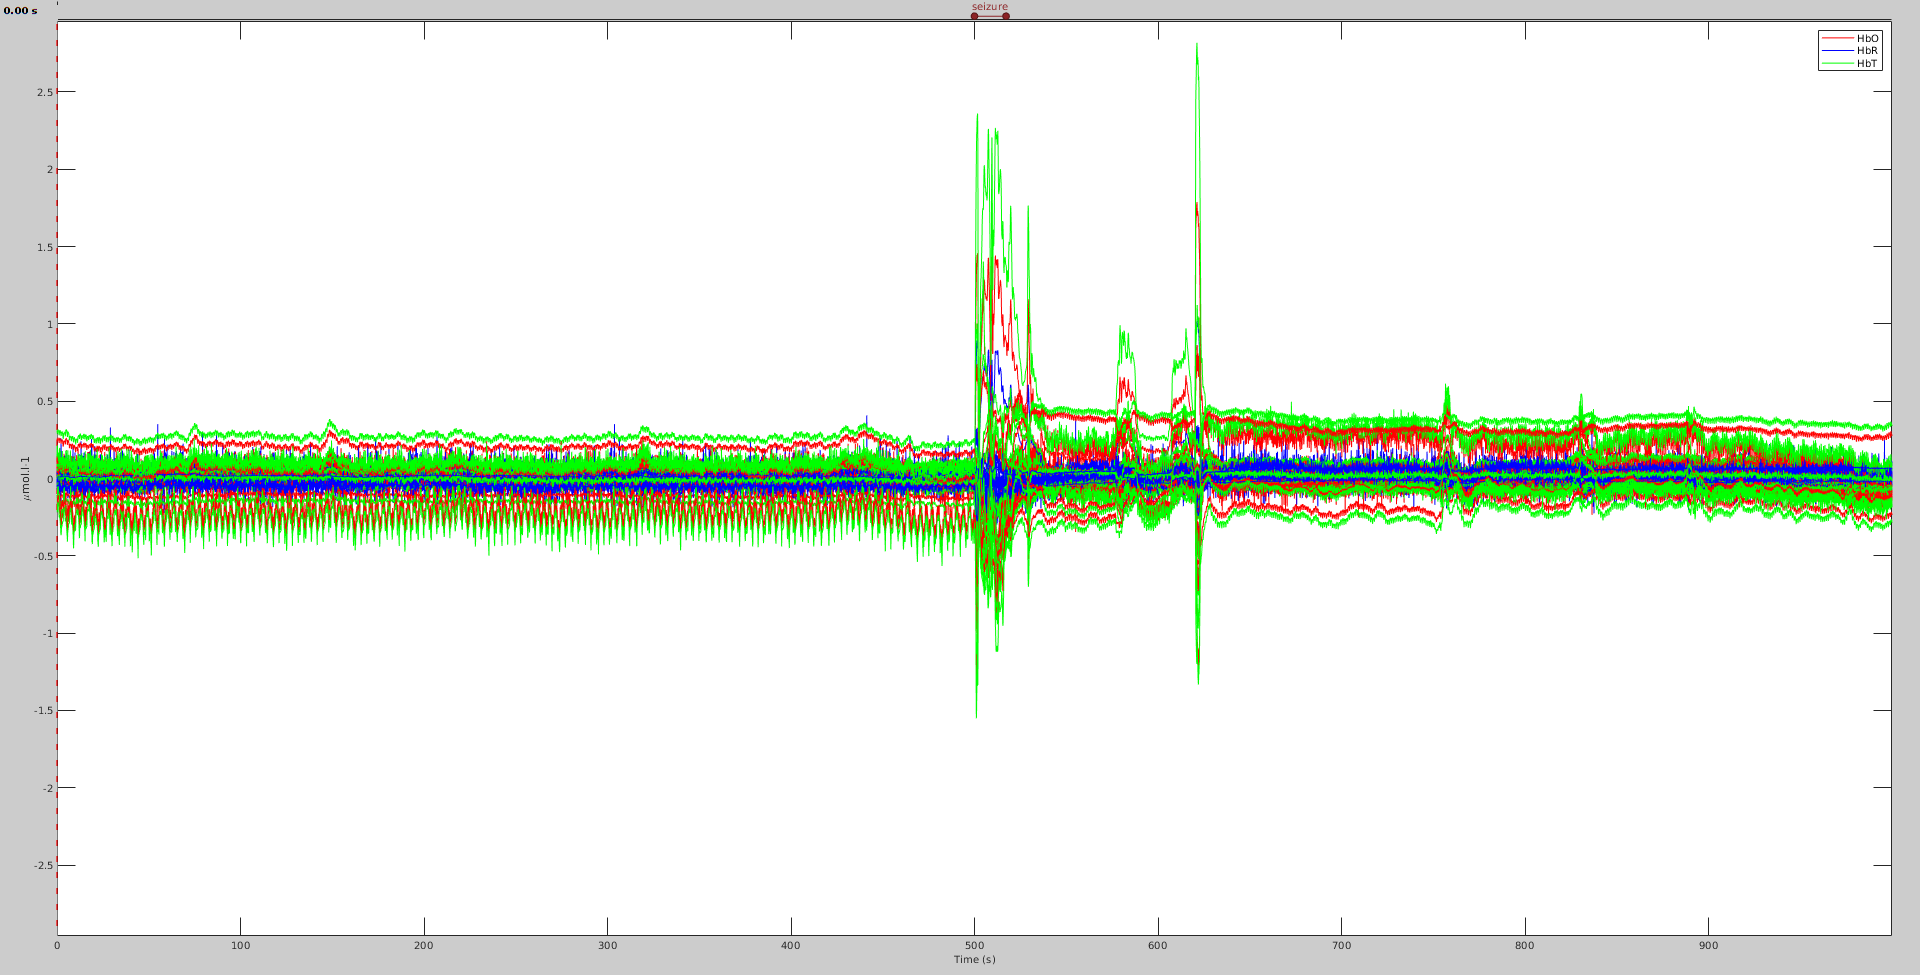
Here i have a NIRS signal that looks like this:
Then I use fieldtrip multitaper to get a time-frequency representation. When opening the results, it is possible to see the recordings. I would expect to see the same signal but just resampled based on the time step used.
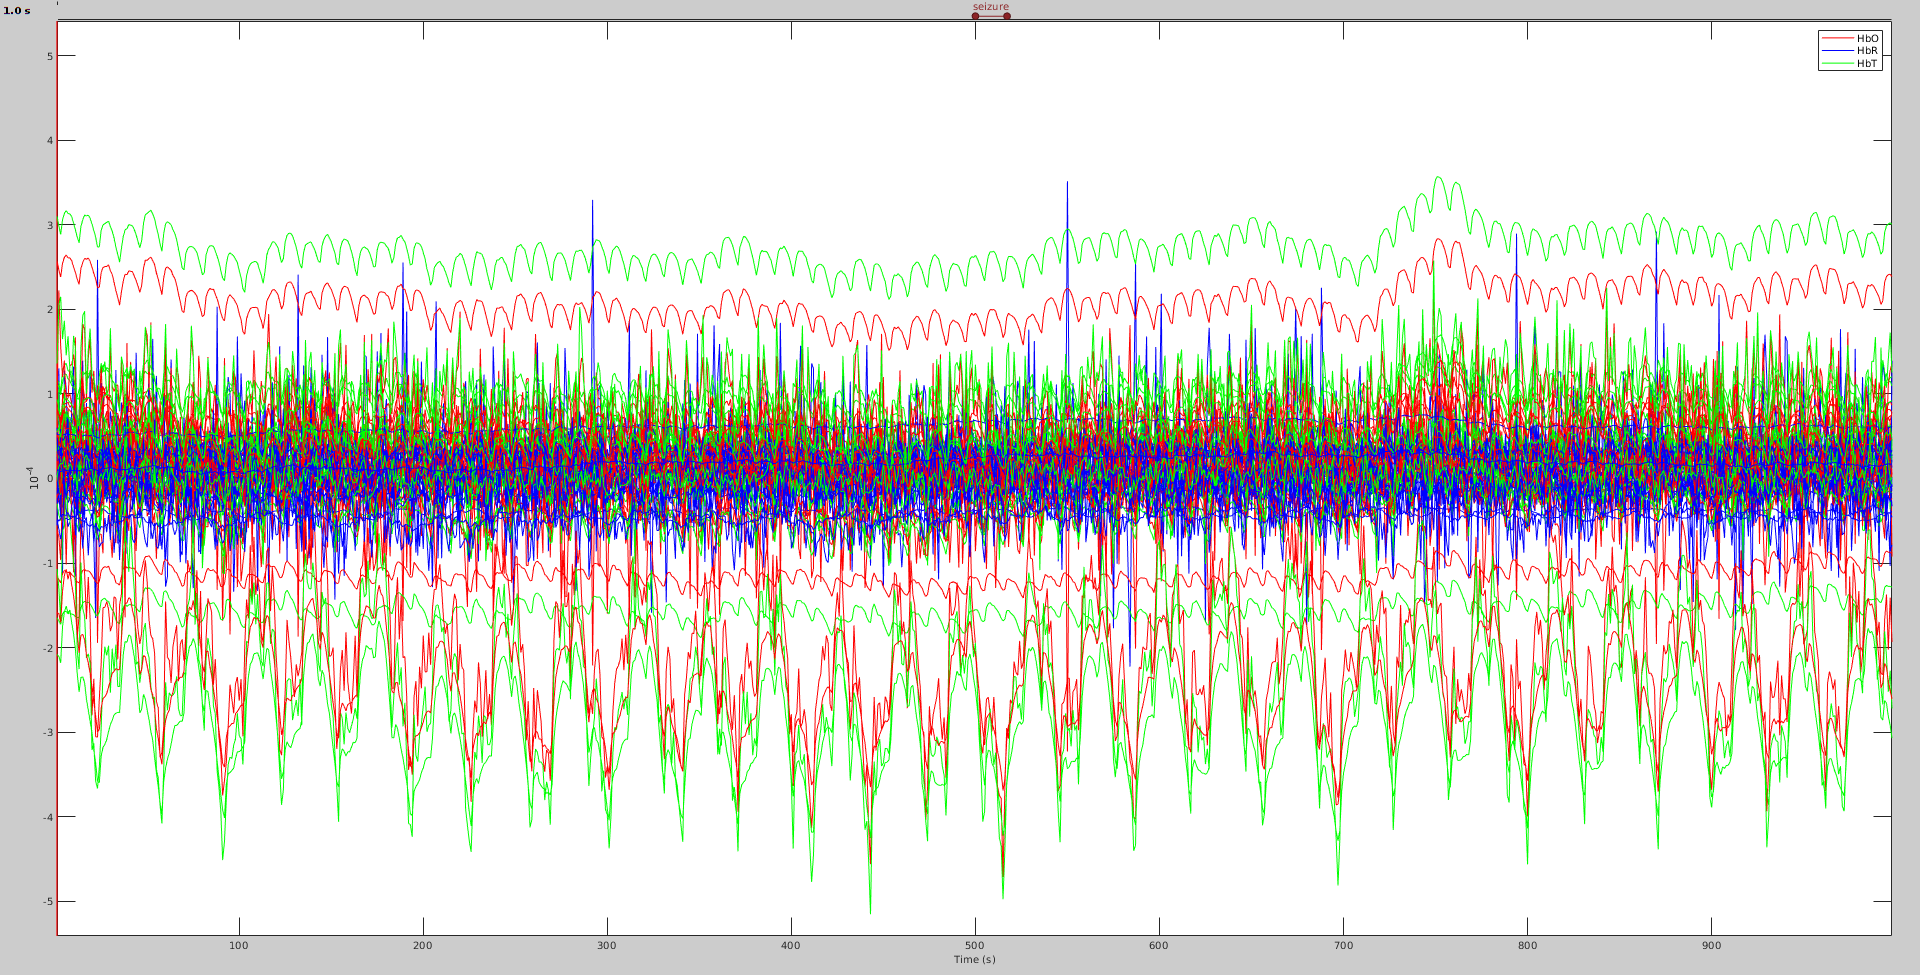
However, the signal looks completely different now
Is there something I am missing?
Here is the parameter I used for the multitaper. (My nirs signal is originally sampled at 10Hz)
Thanks a lot for your help,
Edouard
What do you mean by "now"? What is different between your two screen captures?
Can you describe step-by-step what you do with your data, including screen captures of the files in the database.
The first signal is if i open the signal 'seizure_500s (#1) ..."
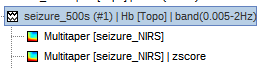
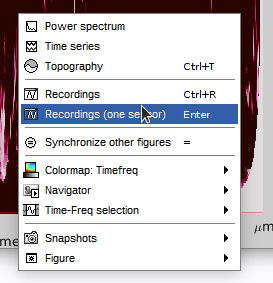
The second signal is if i open the multitaper and use the menu to see the recording:
This happens because the multitaper process creates files with time vectors that are not compatible with the original recordings. When loading the multitaper file, the time vector is heavily downsampled, and it results in the display of the first few time samples only...
It would be a lot of work to rewrite completely the way the multitaper TF maps are handled in memory, so I just disabled this popup menu "Recordings". Hopefully it won't break anything else...
https://github.com/brainstorm-tools/brainstorm3/commit/afbde50a994f65c2a8f97d9b6445d7afe03ea6c6
Sorry for not offering a better solution...
1 Like
No problem 
I was just afraid that the signal seen when clicking the recording was the signal used to estimate the time-frequency map. I am ok if I can't visualize the two at the same time.