Hello everyone,
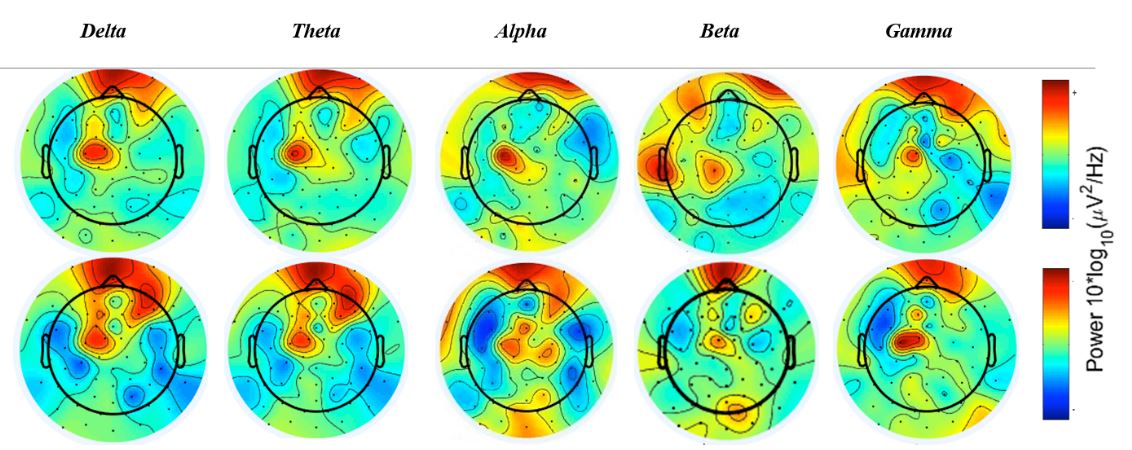
I am new to Brainstorm and I am working on a project regarding concussed individuals. Currently I am trying to see the changes in topography from two different EEG data sets(normal vs concussed), where I want to compare the delta, alpha and theta band differences in different regions of the head. I am doing it by using a band pass filter for 2-4, 5-7 and 8 -12 Hz, for one EEG measurement, and then I do the same for the other.
I saw this in a paper, and I wanted to ask whether it is possible to do in Brainstorm, what the author of this paper has done? If it is possible, how can you do that?
Thank you in advance.
Best Regards,
Kristi
These images were not generated with Brainstorm, possibly with EEGLAB, the article should mention it.
The equivalent in Brainstorm would be something like this:
https://neuroimage.usc.edu/brainstorm/Tutorials/RestingOmega#Power_maps
Possibly with a circle graph instead instead of this "2D sensor cap":
https://neuroimage.usc.edu/brainstorm/Tutorials/ExploreRecordings
If you follow the introduction tutorials carefully (the section "Get started", at least until #19), and then read some additional advanced tutorials related with EEG and resting state, you'll learn how to produce similar figures.
https://neuroimage.usc.edu/brainstorm/Tutorials
https://neuroimage.usc.edu/brainstorm/Tutorials/Epilepsy
https://neuroimage.usc.edu/brainstorm/Tutorials/RestingOmega
Thank you for the fast reply. This will do it.