Hi,
I computed the power spectral density (Welch) on raw MEG recordings and then selected to view the norm of the gradiometers:
right click->MEG (grad norm)->any option
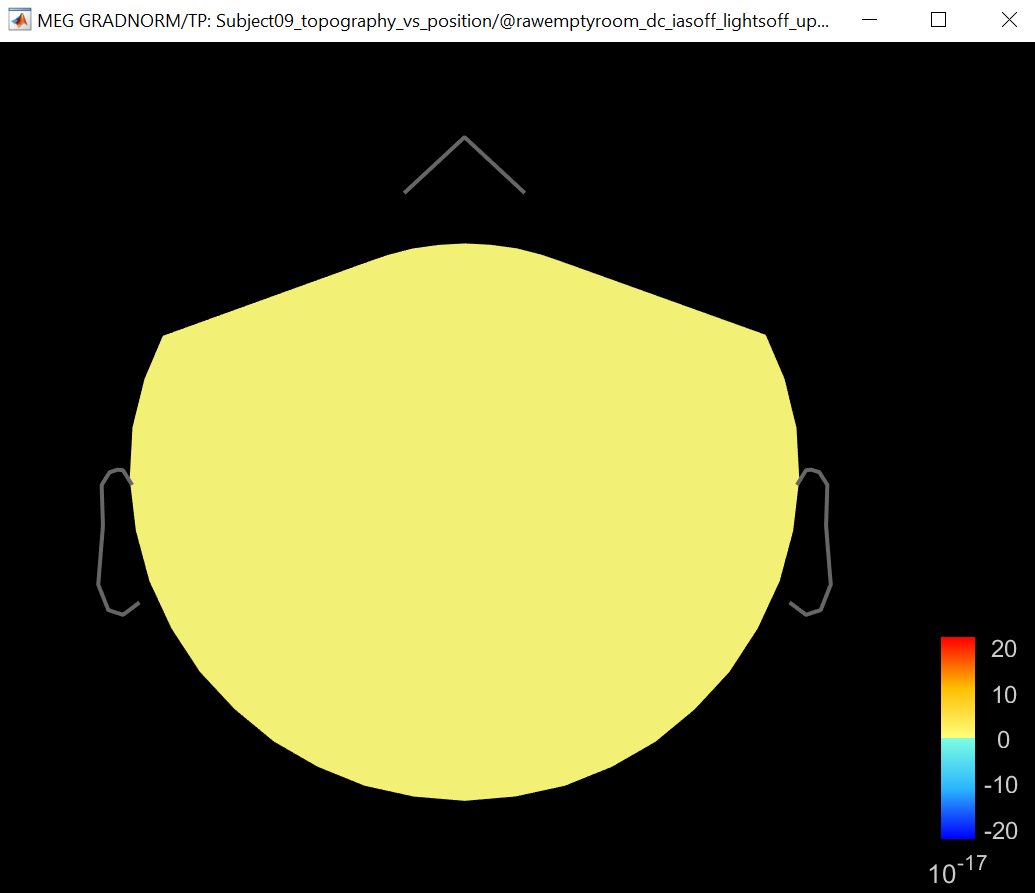
The plots always appear flat:
Thanks,
Dimitrios
Hi,
I computed the power spectral density (Welch) on raw MEG recordings and then selected to view the norm of the gradiometers:
right click->MEG (grad norm)->any option
The plots always appear flat:
Thanks,
Dimitrios
Can you try again with this fix?
https://github.com/brainstorm-tools/brainstorm3/commit/62f1bab38247a0c606c0a1b7b670153ca46122dd