Hello,
I am trying to compute tPAC for my EEG data, which is in a .mat format (i.e., [Channel x Time] with 64 channels). When I plot the outputs, I get 64 tPAC maps that portray phase and amplitude couplings between the phase of first channel and the amplitudes of all 64 channels -- E01:E01, E01:E02, ..., E01:E64. For example, at the top of one plot, it says

I was wondering if there is any way I can compute tPAC maps such that I can see the couplings of the phase and amplitude information within each channel, e.g., E01:E01, E02:E02, ..., E64:E64.
The parameters I have used are as below:
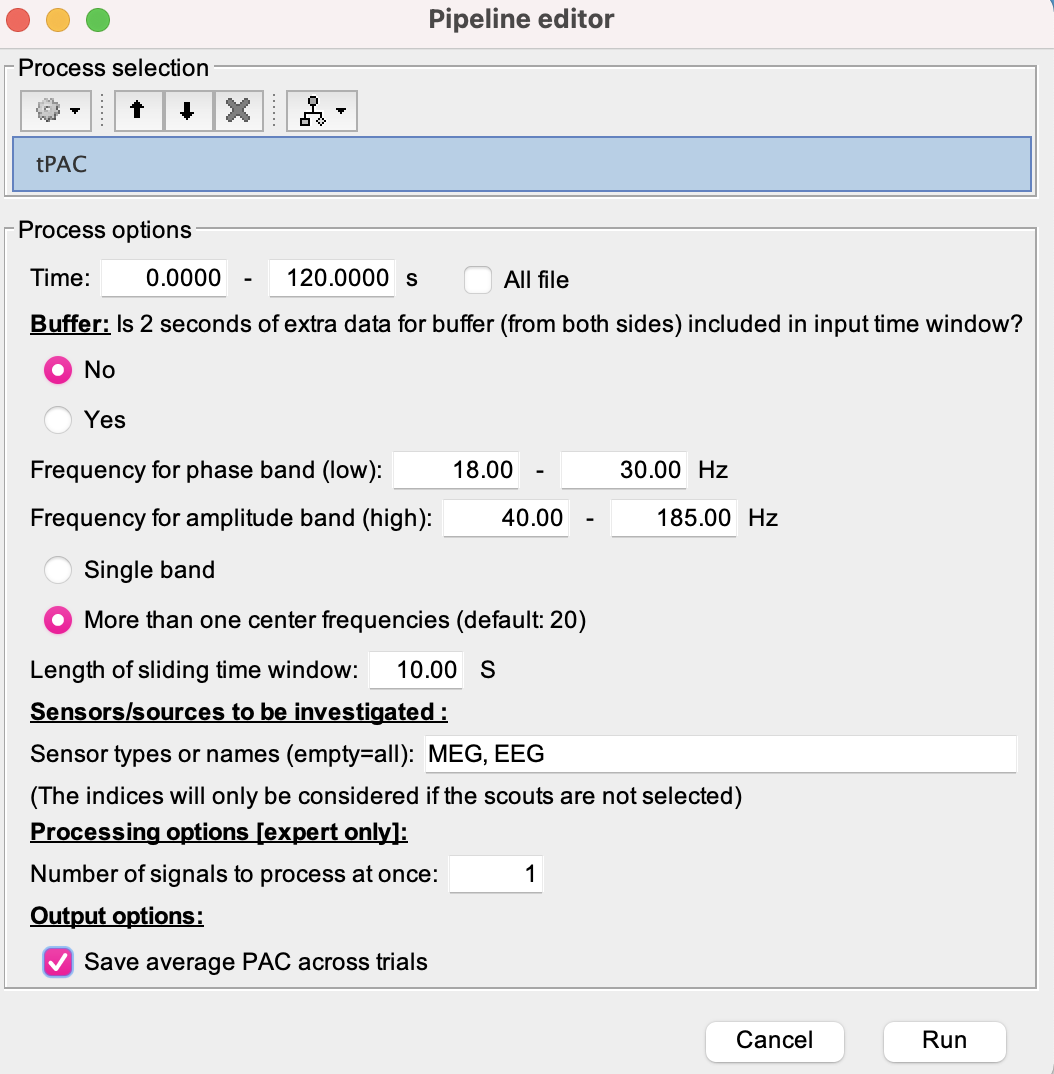
If any further information is needed, please let me know. Thank you!