I ran a PSD on some source data. My options for frequency definition were "matlabs fft defults" or "group in frequency bands"
I ended up running a PSD for both. After, i pulled each PSD into the processing tool box and clicked on relative power for my standardization method.
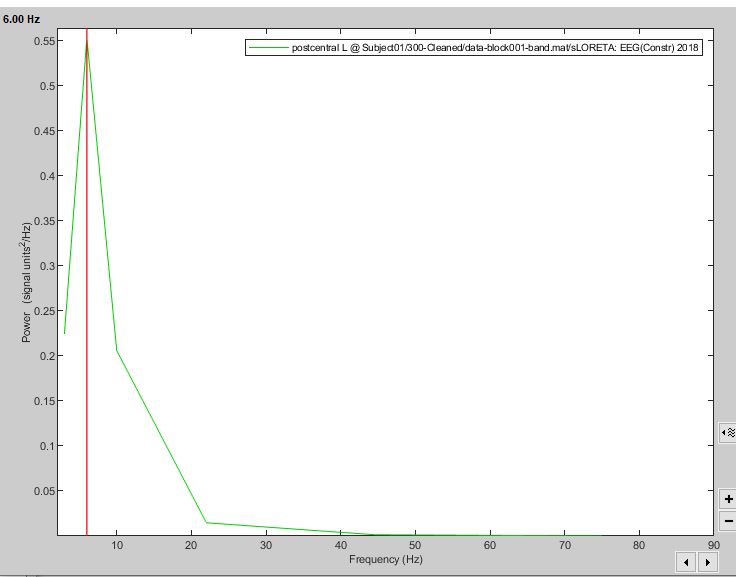
I exported my relative power results for the "group in frequency bands" into matlab and then in brainstorm plotted each relative power spectral density graph ("grouped frequency bands and matlabs FFT defaults) to compare the graphs to my mean frequency bands exported to matlab. Heres the graphs i obtained for relative power ""group in frequency bands"
The power signal in the graph matches up with my relative power spectral density mean power values for each frequency band exported in matlab.
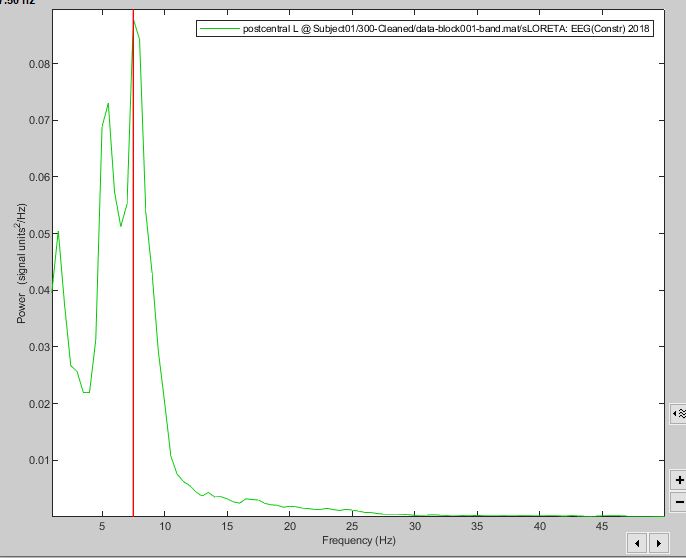
However, the numbers on the y axis in my relative power"matlabs fft defults" graph is not similar to the y axis numbers on my relative power "group in frequency bands" graph and thus, is not similar to my exported relative power "group in frequency bands" mean numbers.
Im wondering why they are not similar. Ultimately i want to graph a relative power spectral density plot that overlays pre and post stimulation for a scout. I like the graph for "matlabs fft defults" better, but my statistics are on the the relative power values from the grouped frequency bands. So i would need my matlabs fft defults graph to line up properly to my grouped frequency band values
If you use the option "group in frequency bands" in the PSD process, or the process "Frequency > Group in time or frequency bands", it computes first the FFT (using the "Matlab`s FFT defaults") and then averages the FFT bins within each frequency band you specify. If your frequency bands are not homogenous, the average value will be lower than peak value, but still in the same range. What explains these much lower values is your normalization.
The relative power is: the power in each band/bin divided by the SUM of all the bands/bins.
With the PSD averaged by frequency bands, you have a much less values that are summed together (one averaged value instead for tens of FFT bins initially), therefore you divide by a much smaller value, and the resulting value is much larger. This measure makes each power value relative to the rest of the data in the same file, and you can't compare it with other files that have a different data structure...
What you observe is normal.
Use a different type of normalization if you're not satisfied with this one.