Hi Francois,
When I apply my forward model (MNE unconstrained, mixed) to project a scout back out to sensor space, from my main scout I get something that looks very reasonable in frequency, power distribution over sensors, relative power across scouts, and over every subject, etc.
However, the amplitude of the signal is very very tiny (in the band I am interested in, I see about +/-8fT deviation in the butterfly plot for the recorded data, and only about +/-0.1fT in my strongest scout).
I have two research questions here - one is the relative amount of information in each of my scouts. I can do this with the existing data. The second one is how much variance is explained in total by sources in a particular scout. This doesn’t make any sense because it’s almost two orders of magnitude difference, the sensor data patterns are nearly identical, and there aren’t any other strong sources.
So either I am using the simulation incorrectly (I have Source: ‘PCA’ set on the scouts, would that change anything?) or could there be a decimal point error in there somewhere? Or is there something else in the forward projection that would cause this?
Emily
Hi Emily,
If you use all the brain for your simulation (no scouts selected), you would get something close in amplitude to the original recordings (minus the “noise” removed by the model).
If you use only a small deep scout the activity in the rest of the brain is set to zero, you get only the part of the brain signals that is supposedly coming from that region. Your very small values do not surprise me.
Francois
That makes sense except I am actually looking at a cortical source! :S Perhaps my small scout is missing the action.
Thanks.
So you shouldn’t see values in fT.
It should be either in dSPM values (similar range as Z- or t-scores), indicated as “no units”, or in pAm if you are using the MN values directly.
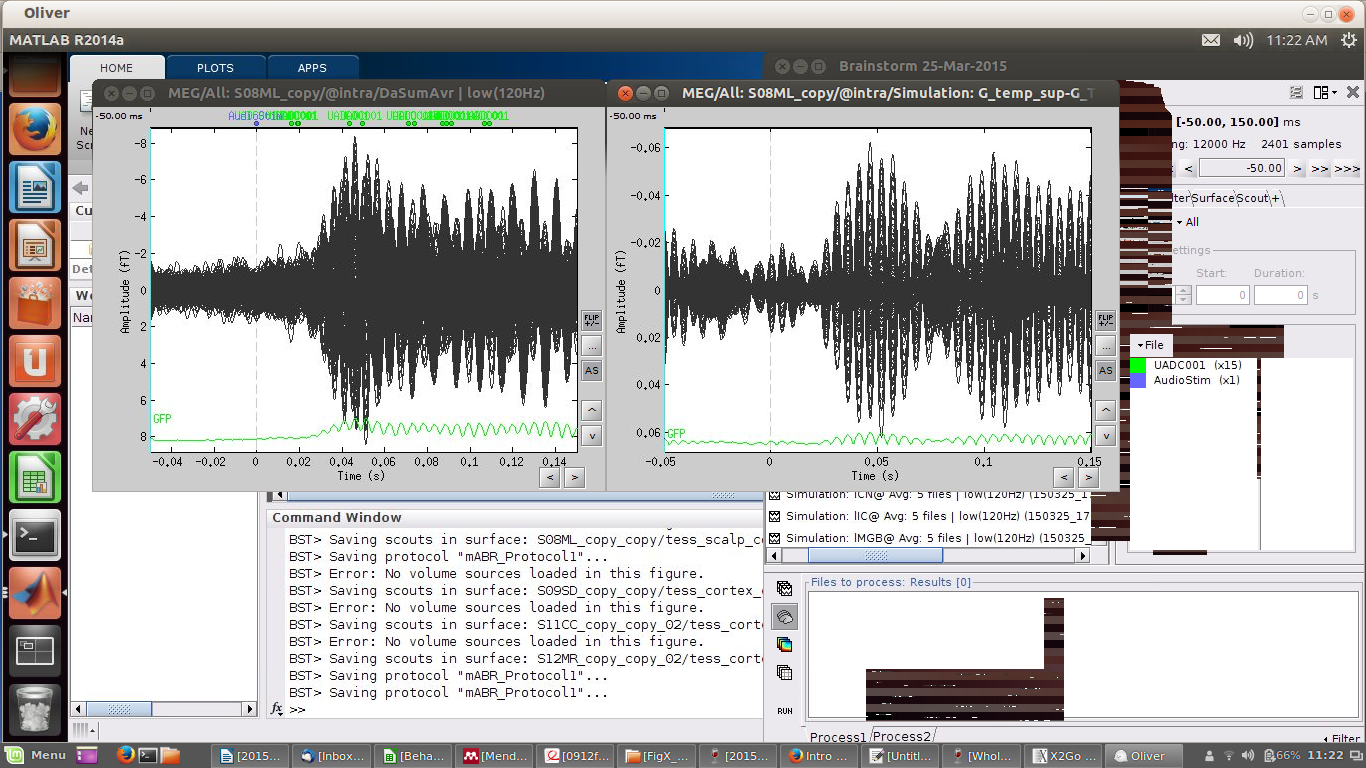
It definitely says fT (see attached) - should I be interpreting them as something else?
Left: actual recorded data, +/-8fT
Right: simulation from main cortical scout, +/-0.06
Hi Emily,
What you are showing here are not the scouts values, but the MEG recordings simulated using only the selected scout as activated.
Amplitudes are correct.
Francois
[QUOTE=Francois;8200]Hi Emily,
What you are showing here are not the scouts values, but the MEG recordings simulated using only the selected scout as activated.
Amplitudes are correct.
Francois[/QUOTE]
That is what I had understood - thanks for the confirmation (maybe I didn’t follow the previous comment). These values still seem suspicously low if we expect most of the signal at this frequency to come from this region. I am trying a whole brain analysis to see the scout is missing the peak activity somehow.