Hello Team,
For my analysis, I need to follow the below code to get similar results for my subjects in brainstorm.
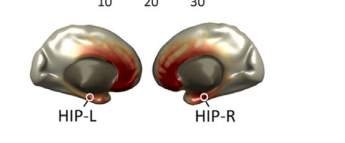
The following code snippets uses fieldtrip to change the power value of the source model and display as below on cortex.
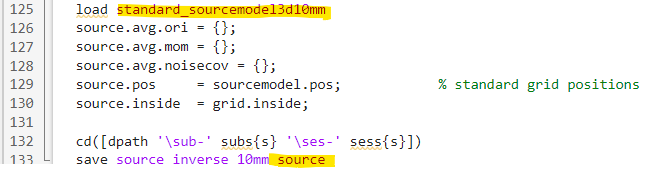
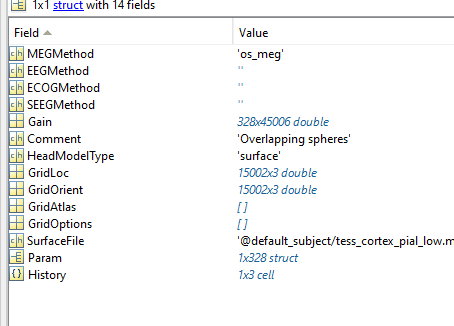
source is a struct as described below
which gets called in line 128 below:
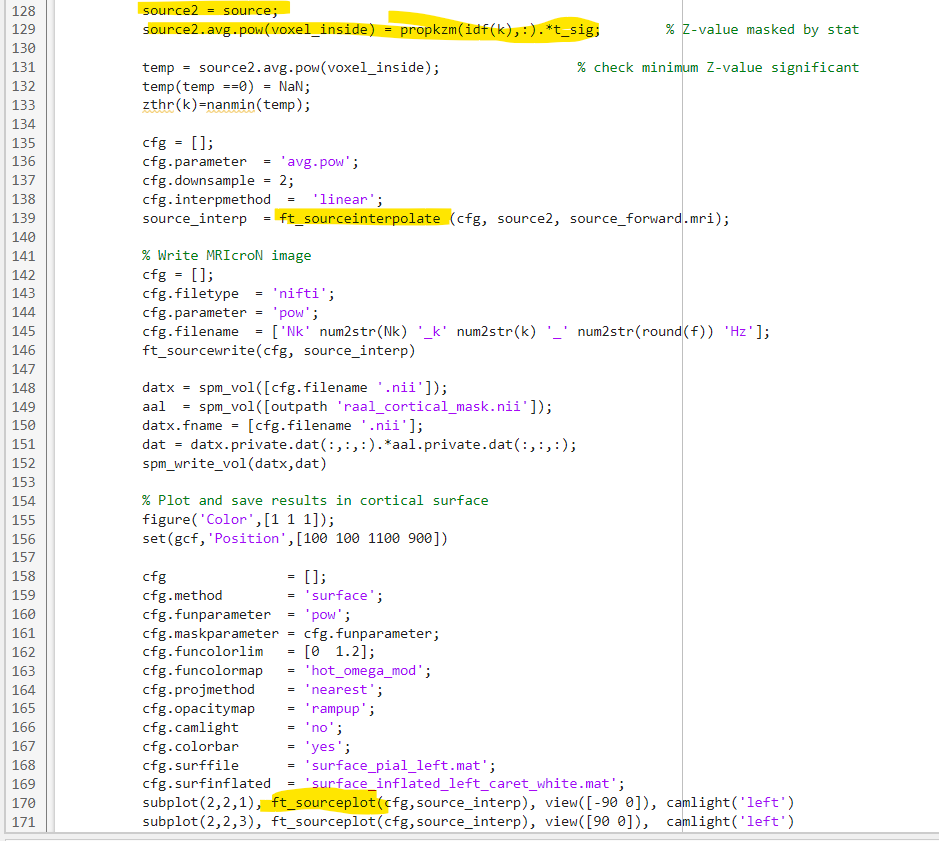
propkzm has power values which is interpolated using ft_sourceinterpolate() at line 139 and plotted at 170.
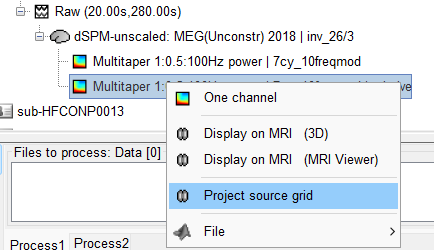
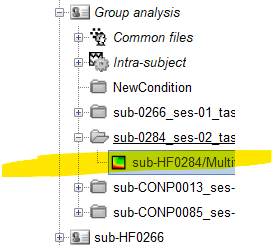
I need to implement something similar in brainstorm. I projected TF results of the reconstructed source data on source grid
and exported the highlighted file to matlab.
Therafter, I changed the TF field to the modified power values of the exported variable and reimported into brainstorm as follows.
It seems there is a misunderstanding in the methodology, the TF is computed for each vertex in the volume source grid thus, the TF is already defined on the volume source grid.
The TF is defined in the volume source grid. So, project them to the cortical surface is not available in Brainstorm. In fact this volume-to-surface projection is not a trivial method. See: https://onlinelibrary.wiley.com/doi/10.1002/hbm.24213
As mentioned before, it is until the projection from volume source to volume MRI space.
You only see that MRI option as the TF is defined in a volume grid, not in the surface grid. For volume-to-surface transformation check the link above. This is not implemented in Brainstorm yet.
"it is until the projection from volume source to volume MRI space." -- Is correct right ?
Okay - I understand volume to surface transformation isn't possible as of now.
However, I am struggling to understand if I am using similar regular grid in brainstorm as they used in fieldtrip. How are they able to able to use ft_sourceplot() [line 170] on the volume TF source data and view results on the cortex as seen below ? Is there a gap in my understanding ?
If it is correct depends on your research question. What I meant that your TF is defined in the volume grid in Brainstorm, and in FieldTrip. Althougth the volume grids may be different.
From the FieldTrip code and documentation, plotting volume sources on the cortical surface is done with a 3D interpolation. You may want to contact the FieldTrip team for more details on the interpolation.
With this 3D interpolation, only vertices in the volume grid that are closer to the cortical surface will be taken into account. This 3D interpolation process can be done in Brainstorm, it is not found in the GUI as it is not recommended. This would be possible in with the function bst_shepards() using as destination the positions of the cortical surface vertices, and as origin the positions of the volume grid vertices, it will give you a matrix of size [nSurfaceVertices, nVolumeVertices] that can be used to "project" from volume to surface. Please note that volume sources are unconstrained, thus there are 3 source time series per vertex, as such, it will be needed to flat first the volume sources to 1 time series per vertex before the 3D interpolation
No, the interpolation from volume source grid to volume MRI voxels happens every time you plot sources on the MRI.
The option project source grid, projects the subject's volume grid sources into the template volume volume grid. I.e., projection between volume source grids.
Because that does not happen there, as stated above. The interpolation between volume source grid to volume MRI voxels happens at plotting. The link to the grid_interp_mri is also above.
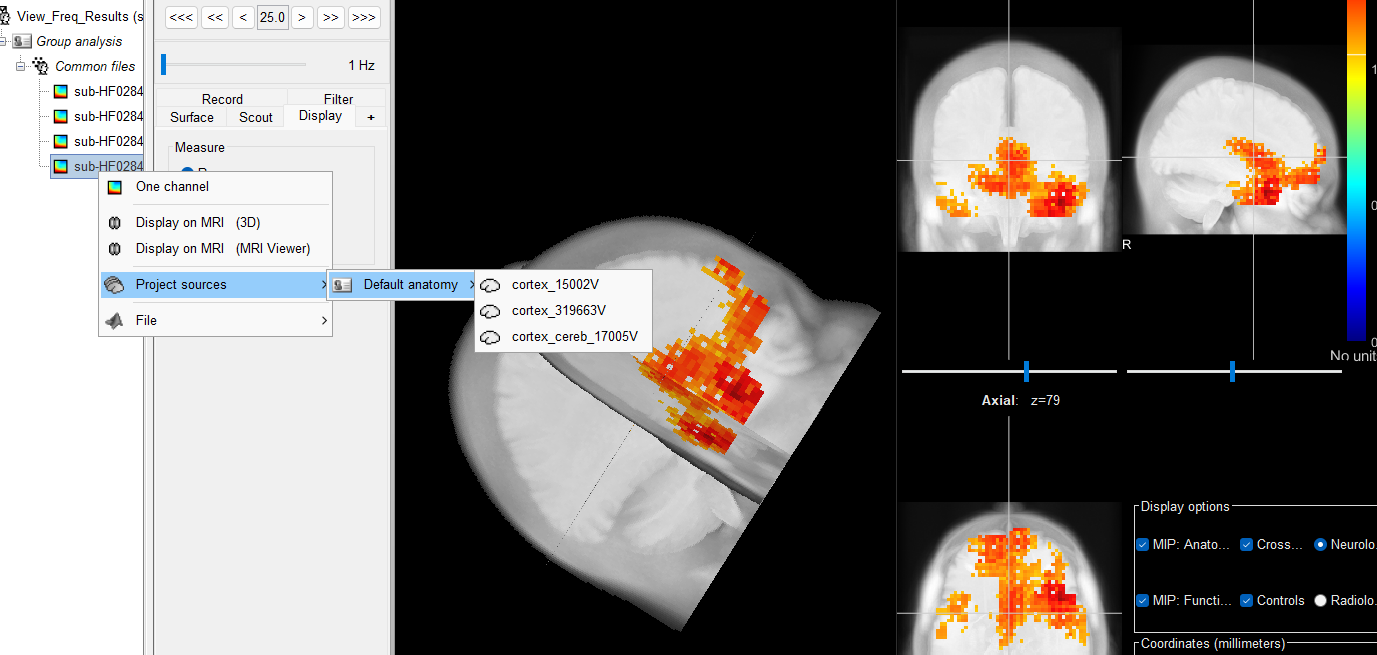
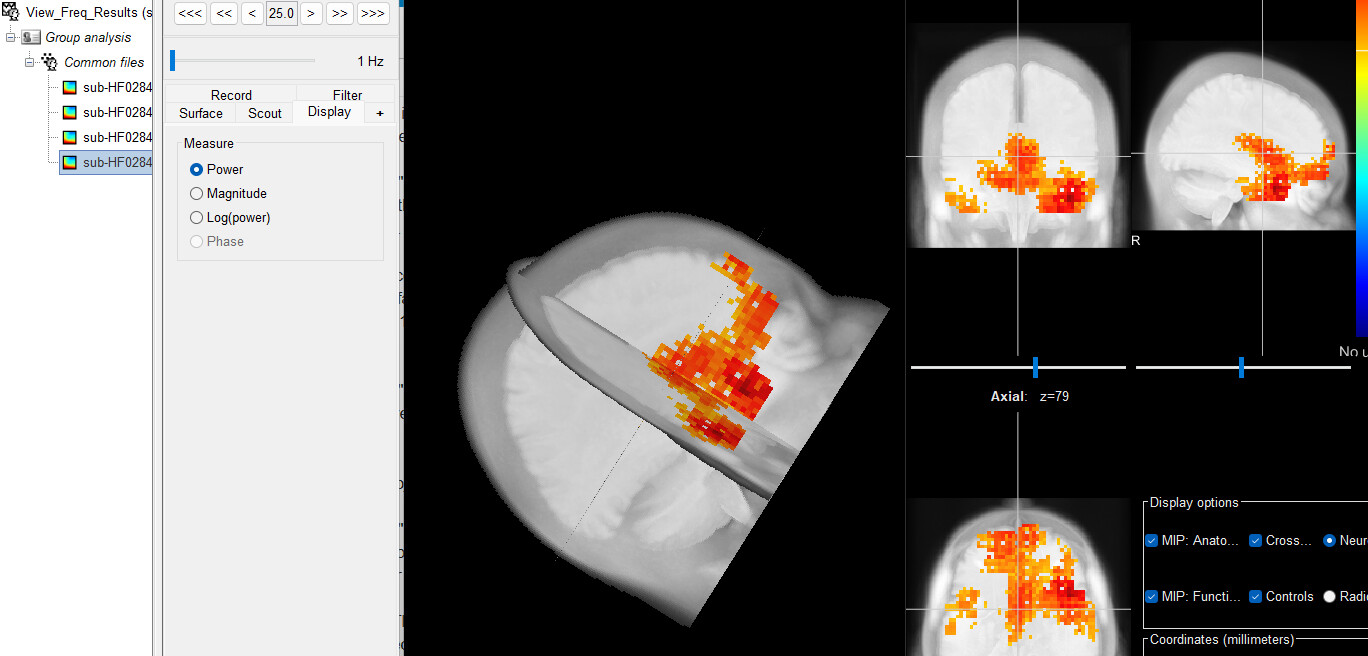
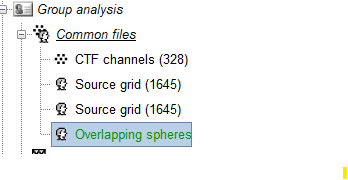
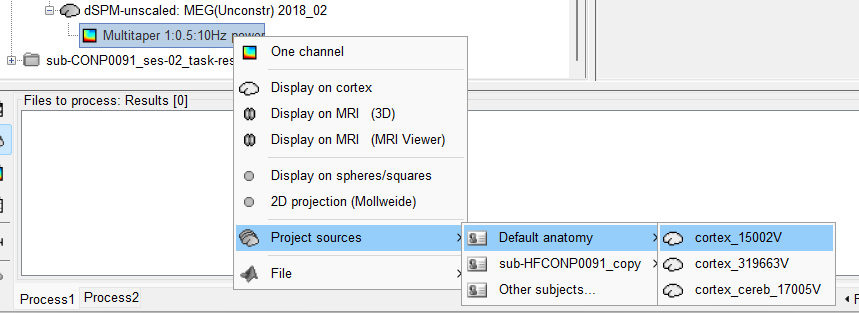
I created an overlapping sphere by clicking on "compute head model" -> cortex -> OK in the group analysis folder
and exported it to matlab
I see there are 15002*3 gain values suggesting unconstrained vertices on the cortex surface.
Is this file to be used as the destination of the cortical surface vertices in bst_shepards() function ?
Overlapping_Spheres.Gain already has unconstrained sources - do I still need to flat the volume sources to 1 per vertex?
The function bst_shepards() gives the transformation matrix between surface and volume vertices. For unconstrained-volume to unconstrained-surface sources, you would need use that matrix in each orientation.
Okay - Can you help me with the example code ? How do I uitilise the transformation matrix / import in brainstorm to view the cortical representation ? Can I visualise TF results of the MRI Voxel grid on the cortex after transformation?
Unfortunately, we cannot provide an example code for this, but you could write it easily with all the information in the thread.
Check the information that is required by bst_shepards
Extract the surface vertices from the surface head model
Extract the volume vertices from the volume head model
Use bst_shepards to get the transformation matrix W
Extract the TF data from TF map computed with volume sources
Multiply your volume TF data with W to transform it in surface, this will give your the surface TF data (if unconstrained, some consideration need to be taken, see posts above)
The volume TF is not compute in the MRI voxel grid, it is computed on the sources volume grid. They are not the same. With the transformation, you will interpolate data from the volume grid to the surface grid.
Hi @Raymundo.Cassani !
I followed your suggested steps and got my surface TF data [15002*1]. How can I visualise this ? In which file/folder should I import the surface TF data ?
Hi Raymundo,
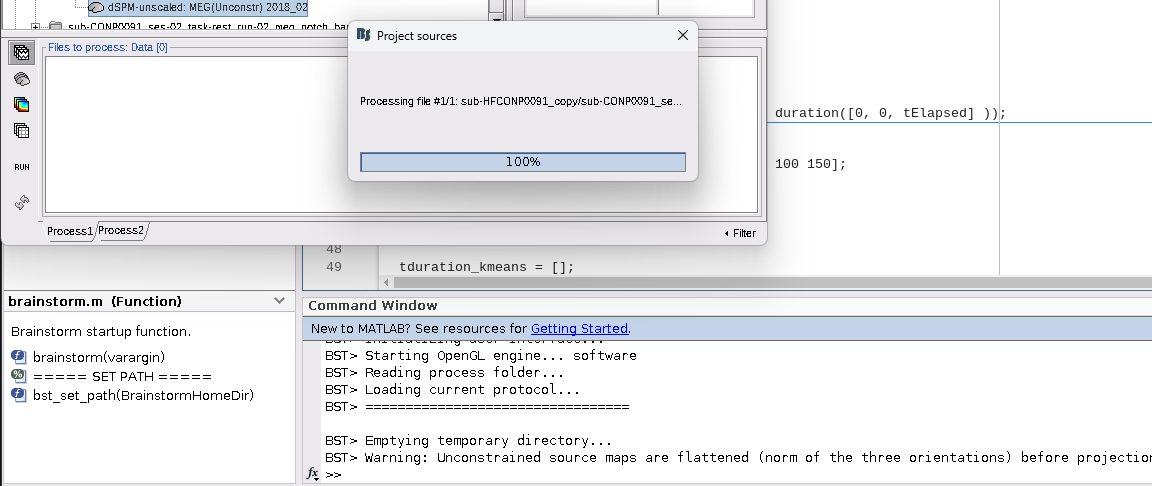
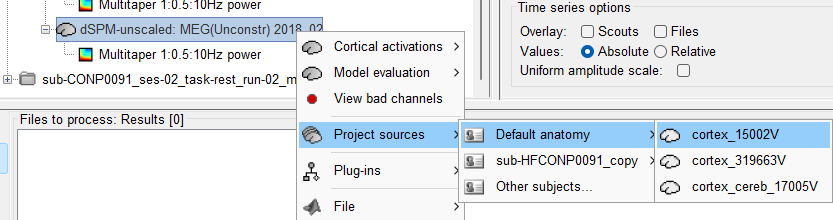
I computed the unconstrained sources on cortical surface for a subject. I right-clicked and selected "project sources -> default subject -> cortex " and the process just shows as 100% with no error log in the command window. I tried multiple times and waited for 30+mins, the prompt box and log was same and matlab eventually crashed.
export the highlighted file and modify the TF values and import it back to brainstorm. I would like to update the TF values for a group of subject. Thus, I am thinking of using just 1 subject's projected TF's file for the group analysis as the above method is not working. What would you advice ?
If it takes long. First ensure, you are projecting to a similar number of vertices 15k (this should be the default cortex in the Default anatomy. Also check the crash is not due to lack of RAM. If there is a message, please share it with us
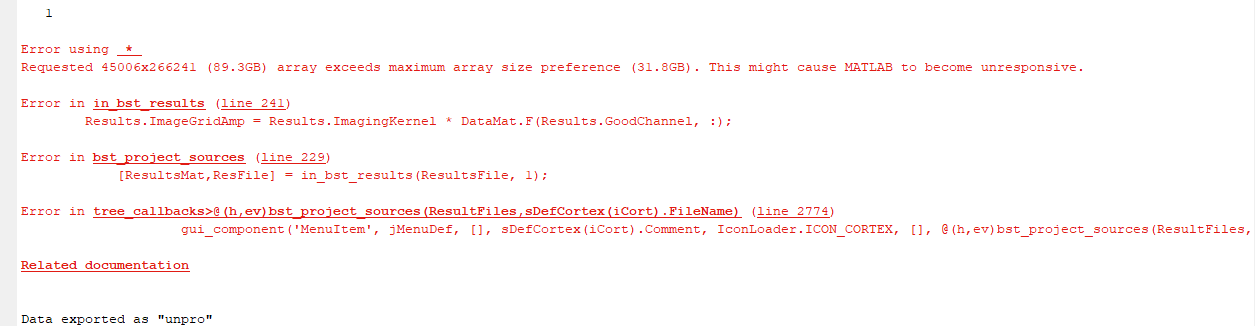
That does not seem a bug, but a trouble with the required file. It is indeed a large source file to load 90GB that's why it crashed.
90GB ~= 15k(vertex) x 3(orientation) x 260(second) x 1024(Hz) x 8(byte)
If your Linux server does not have 90GB available in RAM it may be using swap partition, which is very slow. You can verify this with a system monitor software.
Hi Raymundo,
The Linux Server has 128 GB. But yes, the file is too large and maybe that is why it is crashing. So, I did a workaround by using a shorter segment and computing cortex sources and then project it to default subject. I computed TF with required parameters. However, When I click the TF to view results on cortex/MRI - I am getting the following error. Error while viewing Time Frequency Plot on MRI - Discussions - Brainstorm (usc.edu)
Thanks
Hi @Raymundo.Cassani !
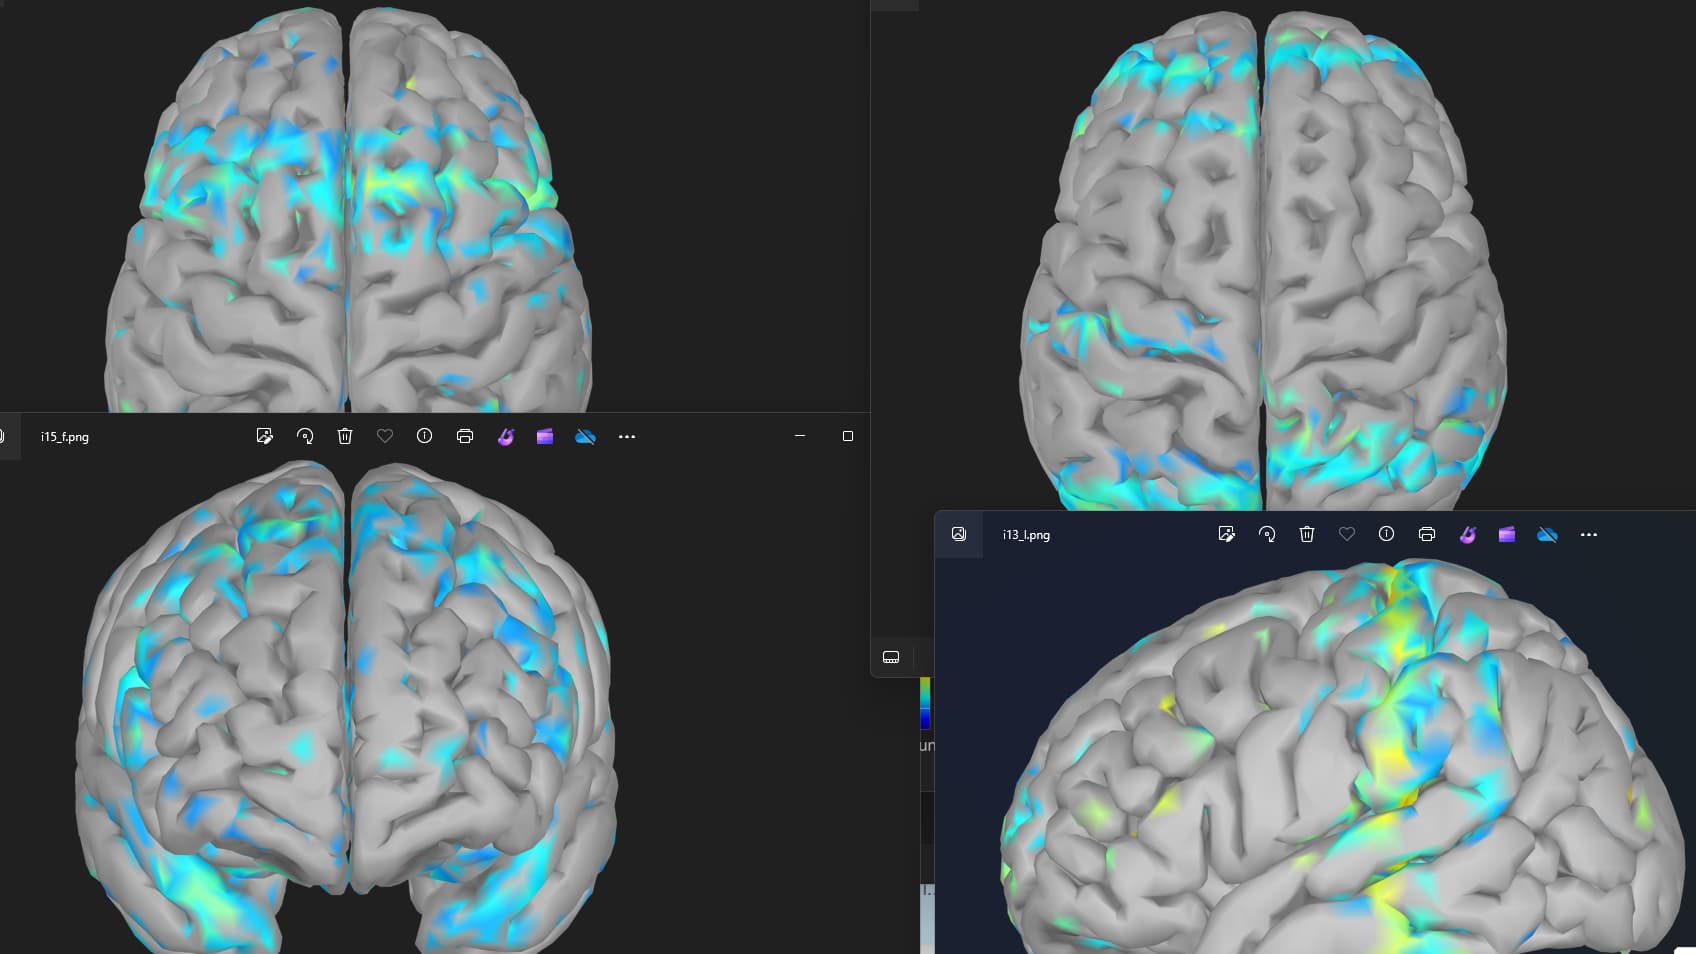
I see bands on the cortex sheets after using bst_shepards function to transform TF results from volume head model to surface head model. I couldn't find any information on why these bands would be occurring from the concerned dataset. Can you help me understand, if this would possibly due to the function ?