Hello,
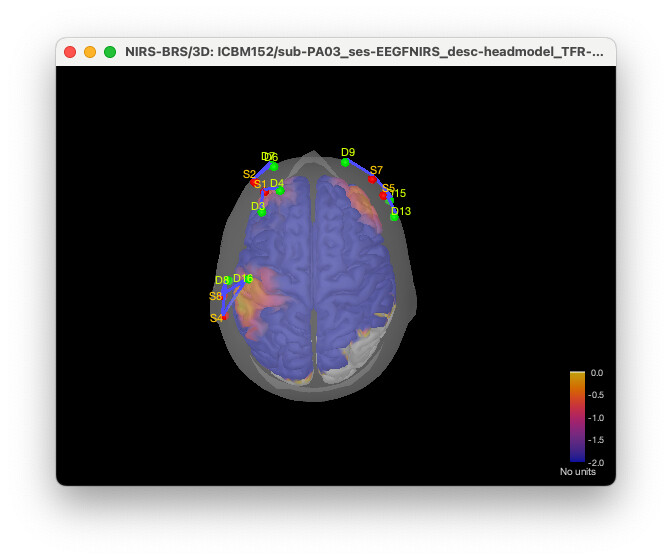
I am trying to create a figure showing the sensors on the scalp and the cortical activity underneath in one single figure.
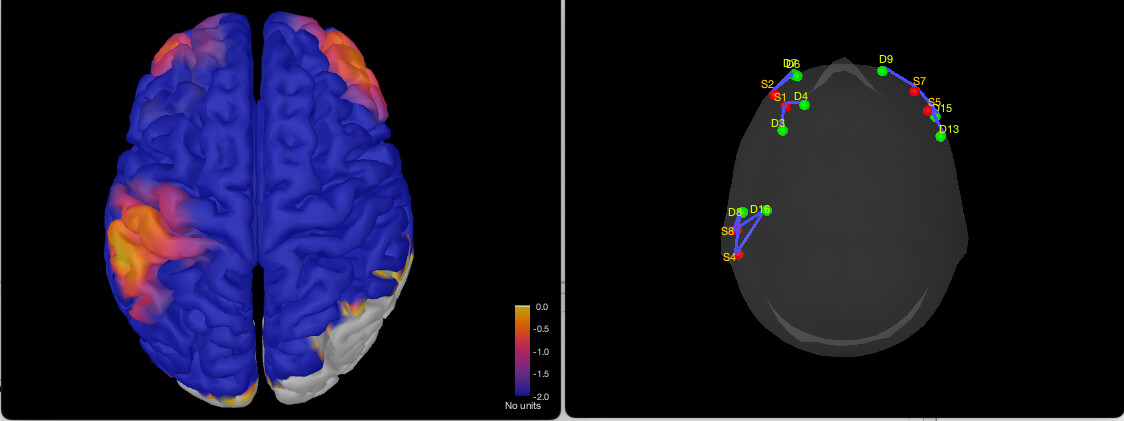
With the following code, I am able to create two separate figures showing what I want:
SurfaceFile = 'ICBM152/tess_cortex_mid_low.mat';
OverlayFile = 'ICBM152/sub-PA03_ses-EEGFNIRS_desc-headmodel_TFR-selection/results_Summed_sensitivities_-_WL1_240228_1526_PA03.mat';

channelFile = 'ICBM152/PA03_sub-PA03_ses-EEGFNIRS_desc-headmodel_TFR-selection/channel_nirsbrs.mat';


[hFig,iFigs,iDSs,iSurfs] = bst_figures('GetFigureWithSurface', SurfaceFile);
view_surface_data(SurfaceFile, OverlayFile,[], hFig,1)


[hFig, iDS, iFig] = view_channels_3d({channelFile}, 'NIRS-BRS', 'scalp', 0, 1);
However, I am not able to combine them into one single figure.
I tried to do this:
[hFig, iDS, iFig] = view_channels_3d({channelFile}, 'NIRS-BRS', 'scalp', 0, 1);
view_surface_data(SurfaceFile, OverlayFile,[], hFig,1)
But I get the following error:
Error using view_surface_data
Could not display file
"ICBM152/sub-PA03_ses-EEGFNIRS_desc-headmodel_TFR-selection/results_Summed_sensitivities_-_WL1_240228_1526_PA03.mat"
on surface "ICBM152/tess_cortex_mid_low.mat"
Also tried:
[hFig, iDS, iFig] = view_channels_3d({channelFile}, 'NIRS-BRS', 'scalp', 0, 1);
[hFig, iDS, iFig] = view_surface(SurfaceFile, 0, [], hFig, 1);
view_surface_data(SurfaceFile, {OverlayFile},'NIRS', hFig,1)
with the same error.
Do you have any idea on how to combine the two figures into a single one?
Thanks a lot,
Edoaurd