Weird looking visualisation when projecting FOOOF output on cortex

4th of September Brainstorm introduced support for fooof toolbox.
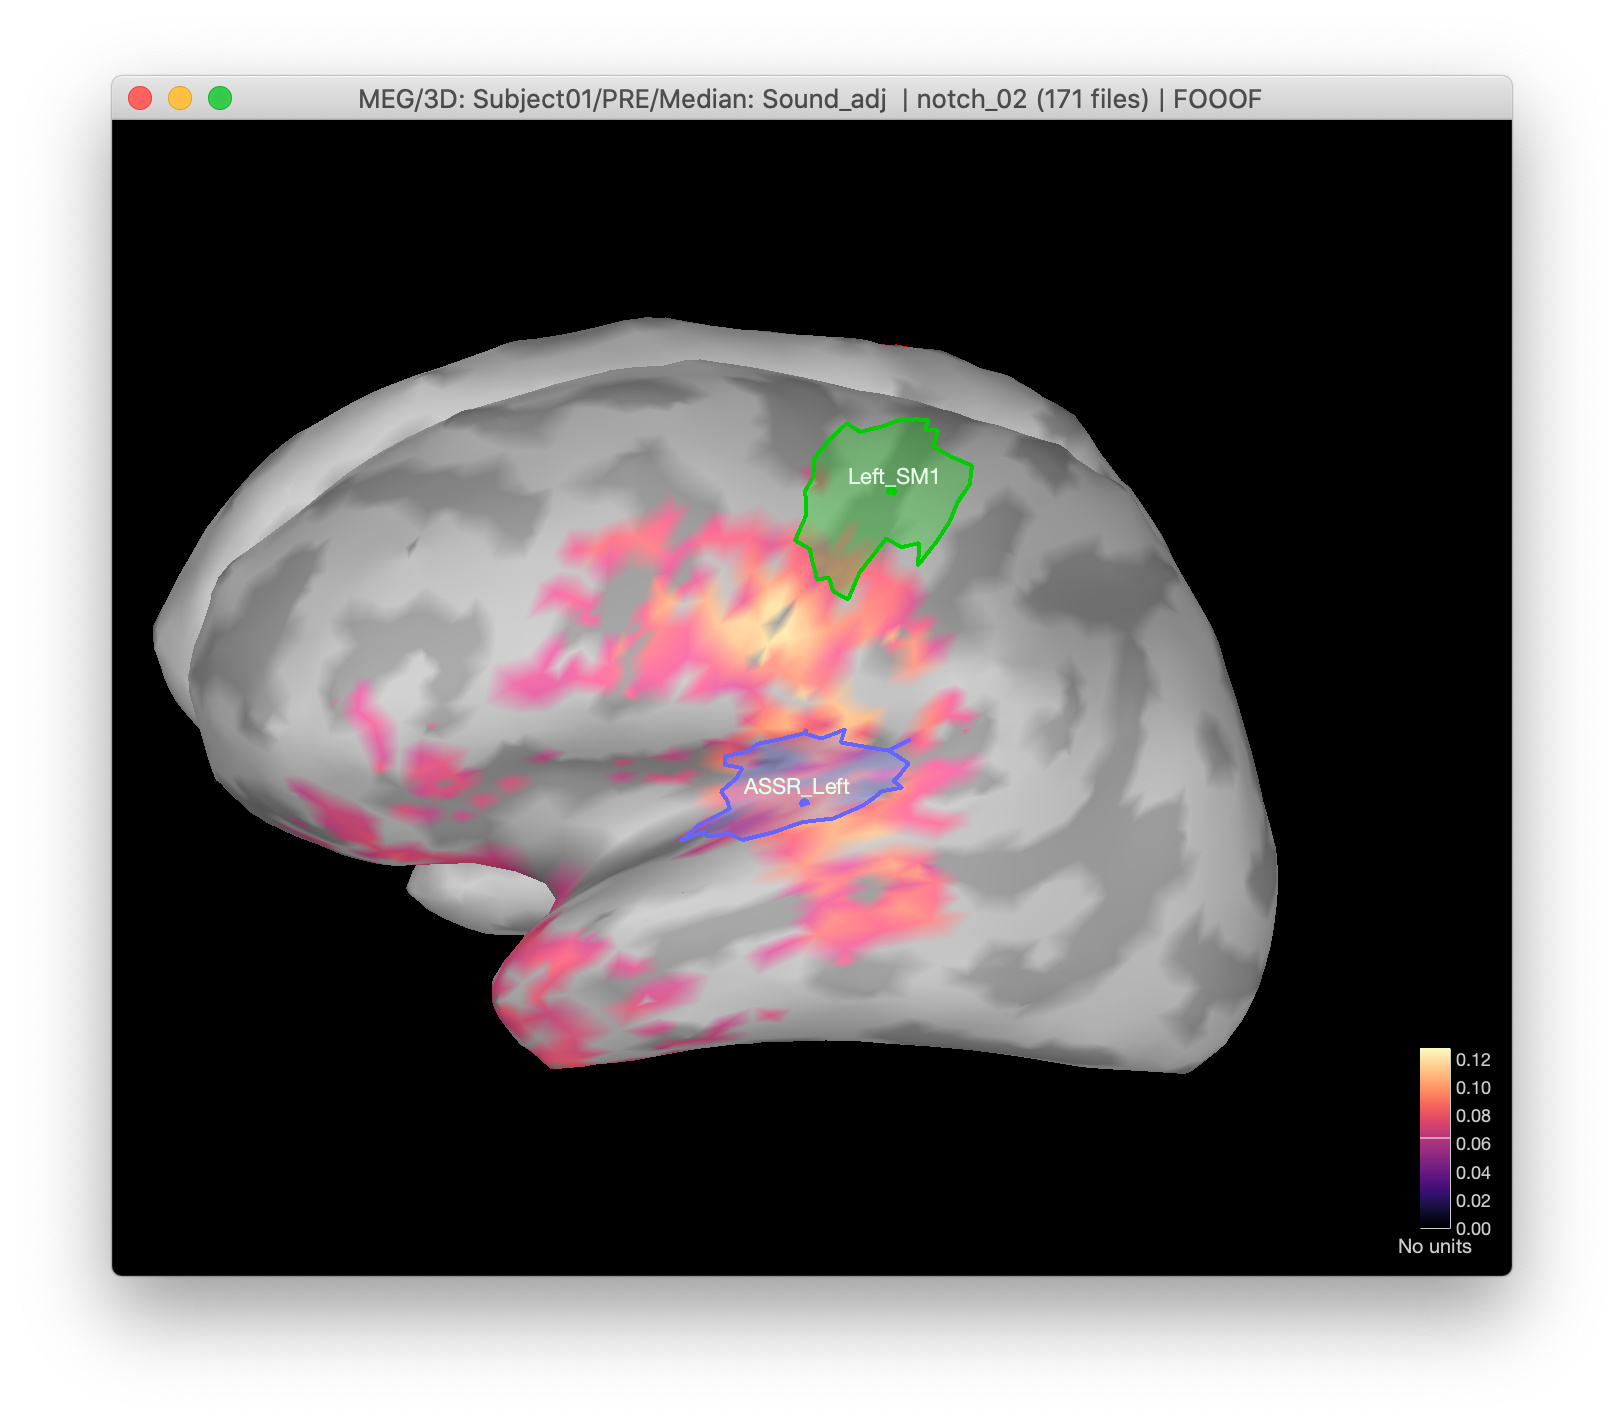
In my current pipeline, I was extracting values from fooof model from reconstructed sources. When running it first time by hand I was able to obtain results that make sense when visualizing the location of the peaks from fooof output (below is response to the stimulation).

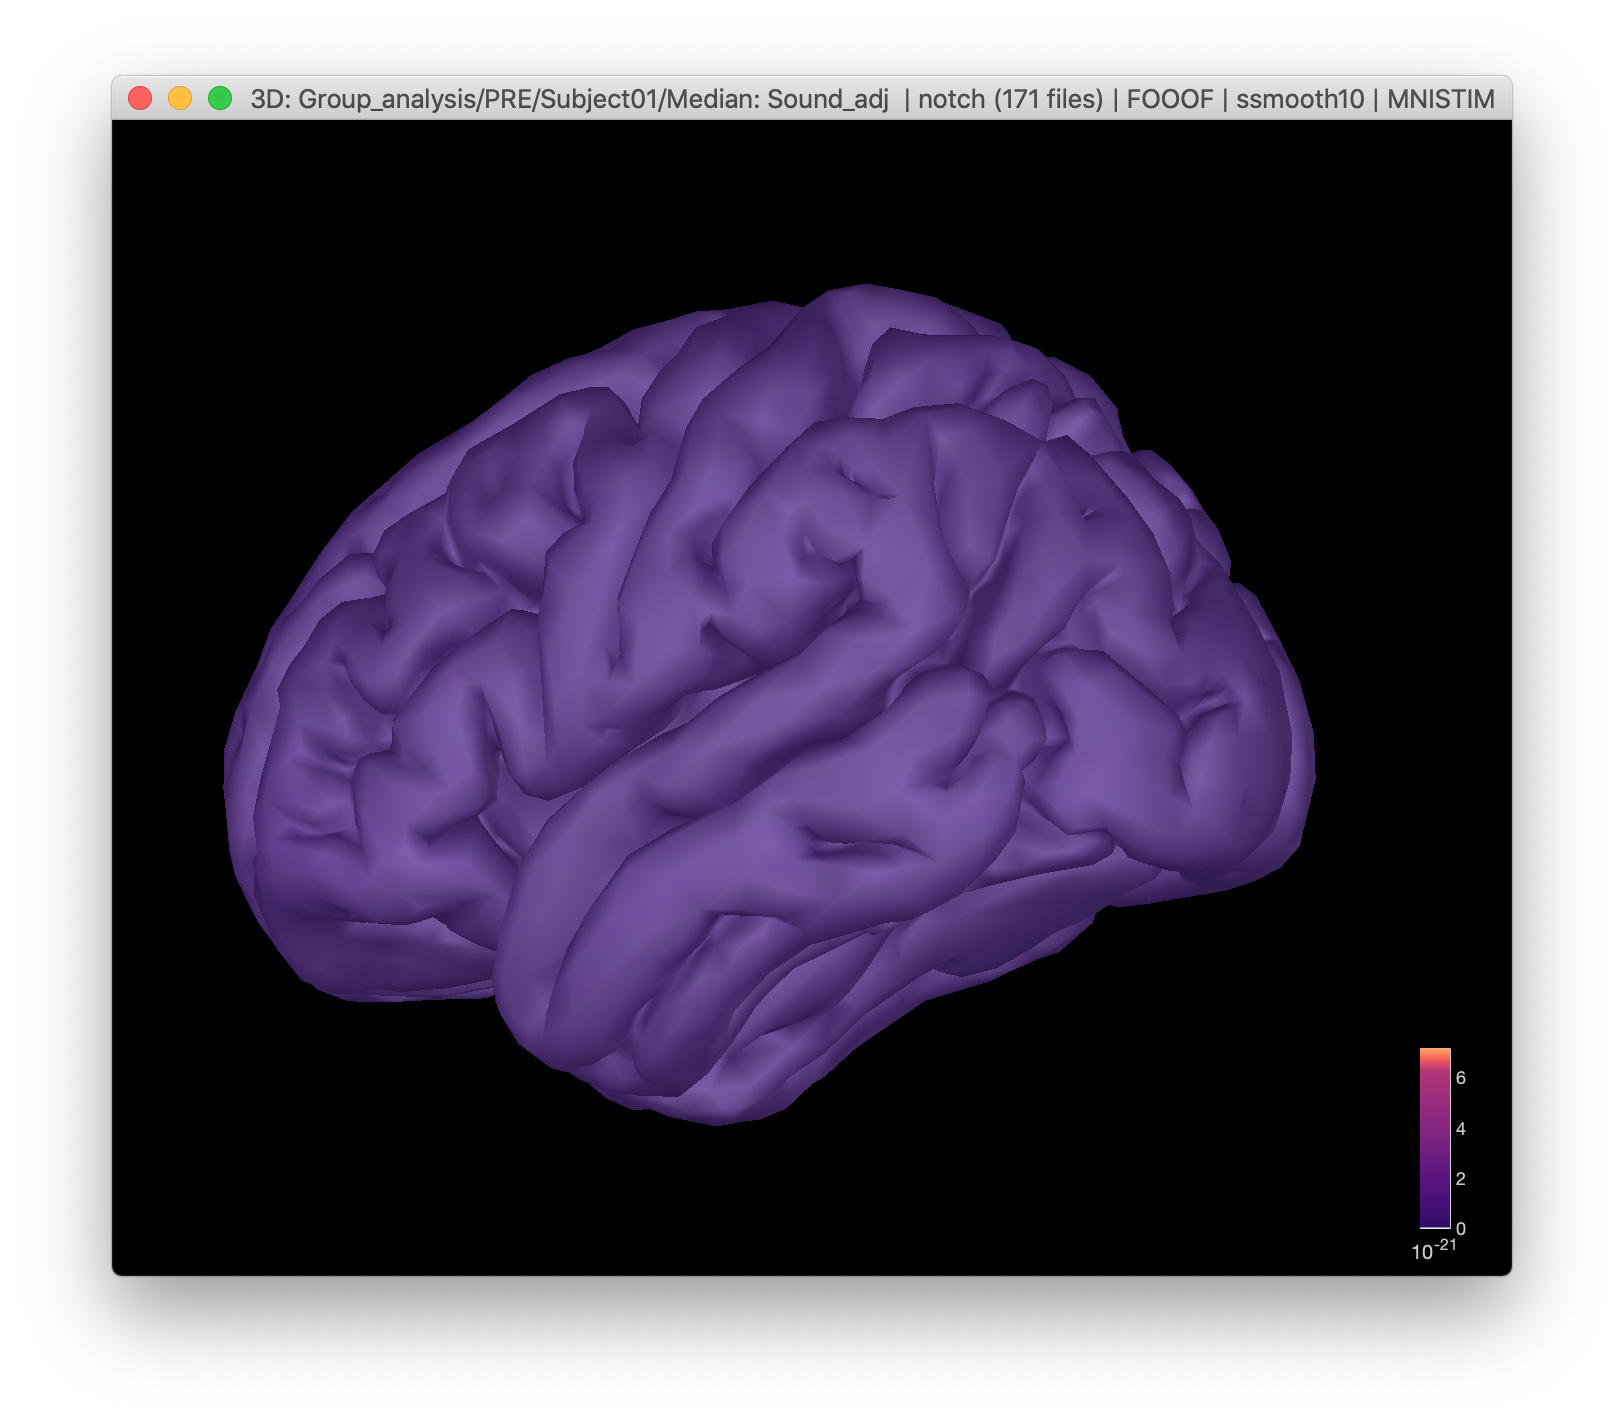
Now when I am trying to reproduce the results, I am getting strange-looking brains.
This picture was made with a setting for 0% amplitude, and the activation disappear when the setting is higher. When I try to plot single spectra or model values they are the same across the cortex. The saved fooof-output file seems to have different values for every source, so it seems ok.

Other times fooof peaks showed up all along with the frequency of the dataset (the fooof is fitted between 2-48, the peaks appeared up to 300hz, it looked like spectrum values were displayed instead of peaks.

Maybe the problem is how I extract PSD for fooof?
In my analysis, I should get the average/median of all spectra across trials, on for every reconstructed source and then I feed the spectra into fooof model.

MY code

% Process: Compute sources [2018]
sFiles = bst_process('CallProcess', 'process_inverse_2018', sFiles, [], ...
    'output',  1, ...  % Kernel only: shared
    'inverse', struct(...
         'Comment',        'MN: MEG', ...
         'InverseMethod',  'minnorm', ...
         'InverseMeasure', 'amplitude', ...
         'SourceOrient',   {{'fixed'}}, ...
         'Loose',          0.2, ...
         'UseDepth',       1, ...
         'WeightExp',      0.5, ...
         'WeightLimit',    10, ...
         'NoiseMethod',    'median', ...
         'NoiseReg',       0.1, ...
         'SnrMethod',      'fixed', ...
         'SnrRms',         1e-06, ...
         'SnrFixed',       3, ...
         'ComputeKernel',  1, ...
         'DataTypes',      {{'MEG'}}));

% Process: Power spectrum density (Welch)
sFiles = bst_process('CallProcess', 'process_psd', sFiles, [], ...
    'timewindow',  timewindow.times, ...
    'win_length',  1, ...
    'win_overlap', 0, ...
    'clusters',    {}, ...
    'scoutfunc',   5, ...  % All
    'win_std',     0, ...
    'edit',        struct(...
         'Comment',         'Power', ...
         'TimeBands',       [], ...
         'Freqs',           [], ...
         'ClusterFuncTime', 'none', ...
         'Measure',         'power', ...
         'Output',          'all', ...
         'SaveKernel',      0));

% Process: Median: By trial group (subject average)
sFiles = bst_process('CallProcess', 'process_average', sFiles, [], ...
    'avgtype',       6, ...  % By trial group (subject average)
    'avg_func',      8, ...  % Median:  median(x)
    'weighted',      0, ...
    'matchrows',     1, ...
    'iszerobad',     1);

% Process: FOOOF: Fitting oscillations and 1/f
sFiles = bst_process('CallProcess', 'process_fooof', sFiles, [], ...
    'implementation', 'matlab', ...  % Matlab
    'freqrange',      [1, 48], ...
    'peaktype',       'gaussian', ...  % Gaussian
    'peakwidth',      [0.5, 6], ...
    'maxpeaks',       6, ...
    'minpeakheight',  3, ...
    'proxthresh',     2, ...
    'apermode',       'fixed', ...  % Fixed
    'guessweight',    'none', ...  % None
    'sorttype',       'param', ...  % Peak parameters
    'sortparam',      'frequency', ...  % Frequency
    'sortbands',      {'delta', '2, 4'; 'theta', '5, 7'; 'alpha', '8, 12'; 'beta', '15, 29'; 'gamma1', '30, 59'; 'gamma2', '60, 90'});

% Process: Project on default anatomy: surface
sFiles = bst_process('CallProcess', 'process_project_sources', sFiles, [], ...
    'headmodeltype', 'surface');  % Cortex surface

% Process: Spatial smoothing (10.00)
sFiles = bst_process('CallProcess', 'process_ssmooth_surfstat', sFiles, [], ...
    'fwhm',      10, ...
    'overwrite', 1);

The problems you describe are difficult to address from your description, there are too many possible things that could have gone wrong, and it is not clear what is it that you show in your screen captures.

We would need an example dataset to be able to reproduce the buggy behavior you describe, and fix the possible bugs. Let's leave alone the projection and smoothing for the moment (at the end of your script), and the scripting (focus only on manual processing).

  1. Right-click on the subject > File > Duplicate subject
  2. Delete the folders with the continuous files
  3. Keep only one folder with a small number of imported epochs (just enough for getting a spectrum that is smooth enough too observe the various peaks)
  4. Keep the spectrum estimations and FOOOF file (only one example) with erroneous results.
  5. Right-click on the subject > File > Export subject
  6. Upload the zip file somewhere (please try to keep this < 500Mb) and post the download link here, together on instructions for reproducing the displays you think are wrong.

Additional note: depending on how long your epochs are, you should probably use the FFT process instead of the PSD. The windowing/overlapping is designed for continuous recordings, when your data is already epoched, you are probably better of directly compute the FFT of the epochs and average their power, to obtain your PSD.
Do you understand this comment or do you need more explanations?

Thanks

@Luc

1 Like

Dear @Francois
Thanks for detailed description how to export subject. Sorry for not answering for your message in autumn.
In September I managed to overcome previous problems but now I have another one.

After running fooof function it doesn't throw out any error but I cannot visualize fooof results.
In the display option choosing any option related to fooof doesn't change anything, it still display features related to power.

Here is the resulting file where I cannot display fooof results.
https://www.dropbox.com/s/bs4v0al2ngf82xv/fft_210125_1428_fooof_Subject01_A_copy.mat?dl=0

I have problem with exporting files needed to run and reproduce this pipeline, they take too much space, but maybe this will be not necessary (if my error is not obvious I will try again to upload files)

% Script generated by Brainstorm (21-Jan-2021)

% Input files
sFiles = {...
    'Subject01_A_copy/S001_ISRASSR_20170220_01_resample/data_Sound_adj_trial001.mat', ...
    'Subject01_A_copy/S001_ISRASSR_20170220_01_resample/data_Sound_adj_trial002.mat', ...
    'Subject01_A_copy/S001_ISRASSR_20170220_01_resample/data_Sound_adj_trial003.mat', ...
    'Subject01_A_copy/S001_ISRASSR_20170220_01_resample/data_Sound_adj_trial004.mat', ...
    'Subject01_A_copy/S001_ISRASSR_20170220_01_resample/data_Sound_adj_trial005.mat', ...
    'Subject01_A_copy/S001_ISRASSR_20170220_01_resample/data_Sound_adj_trial006.mat', ...
    'Subject01_A_copy/S001_ISRASSR_20170220_01_resample/data_Sound_adj_trial007.mat', ...
    'Subject01_A_copy/S001_ISRASSR_20170220_01_resample/data_Sound_adj_trial008.mat', ...
    'Subject01_A_copy/S001_ISRASSR_20170220_01_resample/data_Sound_adj_trial009.mat', ...
    'Subject01_A_copy/S001_ISRASSR_20170220_01_resample/data_Sound_adj_trial010.mat', ...
    'Subject01_A_copy/S001_ISRASSR_20170220_01_resample/data_Sound_adj_trial011.mat', ...
    'Subject01_A_copy/S001_ISRASSR_20170220_01_resample/data_Sound_adj_trial014.mat', ...
    'Subject01_A_copy/S001_ISRASSR_20170220_01_resample/data_Sound_adj_trial015.mat'};

% Start a new report
bst_report('Start', sFiles);

% Process: Compute sources [2018]
sFiles = bst_process('CallProcess', 'process_inverse_2018', sFiles, [], ...
    'output',  1, ...  % Kernel only: shared
    'inverse', struct(...
         'Comment',        'MN: MEG', ...
         'InverseMethod',  'minnorm', ...
         'InverseMeasure', 'amplitude', ...
         'SourceOrient',   {{'fixed'}}, ...
         'Loose',          0.2, ...
         'UseDepth',       1, ...
         'WeightExp',      0.5, ...
         'WeightLimit',    10, ...
         'NoiseMethod',    'reg', ...
         'NoiseReg',       0.1, ...
         'SnrMethod',      'fixed', ...
         'SnrRms',         1e-06, ...
         'SnrFixed',       3, ...
         'ComputeKernel',  1, ...
         'DataTypes',      {{'MEG'}}));

% Process: Fourier transform (FFT)
sFiles = bst_process('CallProcess', 'process_fft', sFiles, [], ...
    'units',     'physical', ...  % Physical: U2/Hz
    'clusters',  {}, ...
    'scoutfunc', 1, ...  % Mean
    'avgoutput', 1);

% Process: FOOOF: Fitting oscillations and 1/f
sFiles = bst_process('CallProcess', 'process_fooof', sFiles, [], ...
    'implementation', 'matlab', ...  % Matlab
    'freqrange',      [1, 50], ...
    'peaktype',       'gaussian', ...  % Gaussian
    'peakwidth',      [0.5, 12], ...
    'maxpeaks',       3, ...
    'minpeakheight',  3, ...
    'proxthresh',     2, ...
    'apermode',       'fixed', ...  % Fixed
    'guessweight',    'none', ...  % None
    'sorttype',       'param', ...  % Peak parameters
    'sortparam',      'frequency', ...  % Frequency
    'sortbands',      {'delta', '2, 4'; 'theta', '5, 7'; 'alpha', '8, 12'; 'beta', '15, 29'; 'gamma1', '30, 59'; 'gamma2', '60, 90'});

% Save and display report
ReportFile = bst_report('Save', sFiles);
bst_report('Open', ReportFile);
% bst_report('Export', ReportFile, ExportDir);

@Luc
Any suggestion?

1 Like

Just finished taking a look at the .mat file provided. It looks like there are more TF rows (15002) than there are rows in Options.FOOOF.data (8002). There may also be an issue with using doubles to refer to RowNames instead of a cell array of strings.

If I am understanding this correctly, the aim is to plot FOOOF models of sources on the cortex, yes? If so, I have not yet looked into this (although I could try to add it by March) and so for the time being, computing FOOOF models on sources is not yet a 'vetted' process. Essentially, while no errors might be thrown for computing FOOOF models at the source level, the process interprets every source as a channel, and requires there to be an equal number of TF rows to the number of FOOOF models (visualizing the data requires 1 - 1 replacement of rows).

For a quick fix, you can visualize the FOOOF models by trimming the TF matrix to 8002 rows and re-importing the data, as well as converting the RowNames to strings in a cell array:

a.RowNames = cell(1,8002);
for k = 1:8002
a.RowNames{k} = num2str(k);
end

However, you may notice that some of the FOOOF models are not great fits (although I cannot explain why they are this bad).

1 Like

Thanks for detailed explanation!
Could it matter if I am choosing MATLAB or Python implementation of fooof algorhitm?

I could export sources, compute fooof walues in python and try to reimport values into Matlab (I didnt find yet any other way to visualize brainstorm sources on cortex in Python so far) Any tips how could I avoid some possible pitfalls?

No worries, happy to help where I can!

Both implementations have been designed to provide nearly the same output structures and values, so I don't think it should matter which implementation you are using. Again, I think this comes down to the intricacies involved with interpolating the source signals from the channels, given that I have not looked into the differences in data structures between source and channel.

For now, there is no supported way to overlay FOOOF models or their components on cortex in Brainstorm. However, I'll look into adding support for this as soon as I can!

1 Like