Hi everyone,
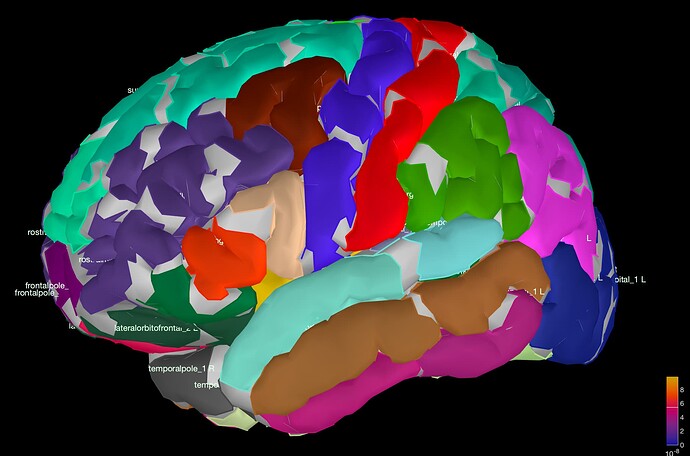
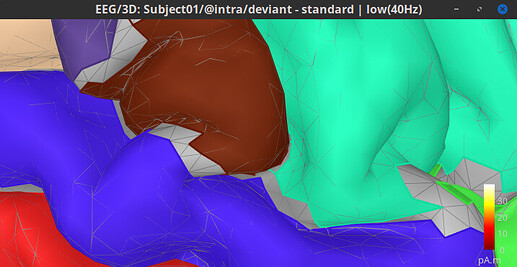
I am wondering if anyone knows what the grey gaps are in the brain scout map are?
In my methods, I used scalp EEG data, which I pre-processed on Brainstorm. I used the ICBM MRI template, warped my eeg sensors, applied notch, bandpass filters, removed artefacts etc.
Then, I created a headmodel "Open MEEG BEM" and used sLORETA for source localisation. When I open the sLORETA: EEG(Constr) and select "laus60" I get the following brain scout image (see attached).
(1) Does this mean the signal from the grey areas is not included in my analysis because Lausanne parcellations do not capture the full cortical regions?
or, (2) is this an illustration issue? the regions are being fully captured but the parcellation is trying to visually define the individual segments in one region ie: superior temporal region is split into superiortemporal1, superiortemporal2, superiortemporal3, superiortemporal4,... and so on. (the effect is worse as the parcellation number goes up)
Thank you!

