Hi all. I have a protocol in which I have completed source analysis of EEG, and have also done several FFTs for particular ROIs. In addition, I performed a whole-brain FFT for each condition and subject. When I import this FFT mat file into MATLAB, it is number-of-vertices x 1 x number-of-FFT-bins, which I expect. There is some analysis I want to do outside of Brainstorm on these FFTs. My question is whether these vertex locations are in MNI space; in other words, does it make sense to average these FFTs over subjects outside of Brainstorm because all vertices are in the same place for each subject, or are the vertex locations in general at different places in the brain for each subject? I did an MNI transformation for all subjects earlier in the pipeline.
And after I have this average FFT over subjects, I am wondering how to visualize it in Brainstorm. Appreciate anyone's advice on this when you have a chance, and I can provide more information about the pipeline if needed. Best,
Yi
My question is whether these vertex locations are in MNI space; in other words, does it make sense to average these FFTs over subjects outside of Brainstorm because all vertices are in the same place for each subject, or are the vertex locations in general at different places in the brain for each subject?
If you have computed your sources using the same default anatomy (eg. ICBM152 template), the source space is the same for all the subjects, you can directly average the values you obtained across all the subjects.
If you have imported an individual anatomy for each subject (eg. MRI processed with FreeSurfer + individual realistic 3D positions for the electrodes), then the source spaces are different, you cannot assume that the dipole #i corresponds to the same anatomical location in two different subjects. In this case, you need to project your source maps on a common template (eg. MNI ICBM152) first:
https://neuroimage.usc.edu/brainstorm/Tutorials/CoregisterSubjects
There is some analysis I want to do outside of Brainstorm on these FFTs.
And after I have this average FFT over subjects, I am wondering how to visualize it in Brainstorm.
The easiest is to save your modified FFT files into the Brainstorm database, and use the Brainstorm interface to average them and display the results. Some examples in the scripting tutorial:
https://neuroimage.usc.edu/brainstorm/Tutorials/Scripting#Custom_processing
If you are interested in writing clean code that you could share (and possibly add to the Brainstorm distribution), you could try to write your code as a process (=plugin):
https://neuroimage.usc.edu/brainstorm/Tutorials/TutUserProcess
Thanks.
I was able to 1) project my source maps on a common template, 2) do analysis outside of Brainstorm on the FFTs, and 3) average the FFTs across subjects and visualize it in Brainstorm.
Because I am also interested in source localization of the subcortical regions, so I followed this tutorials and created a volume source model.
https://neuroimage.usc.edu/brainstorm/Tutorials/CoregisterSubjects#Volume_source_models
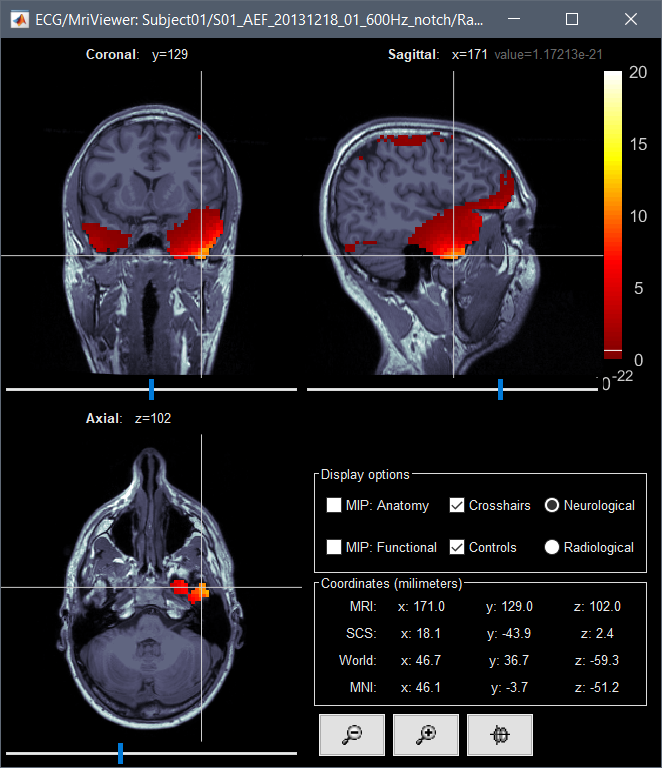
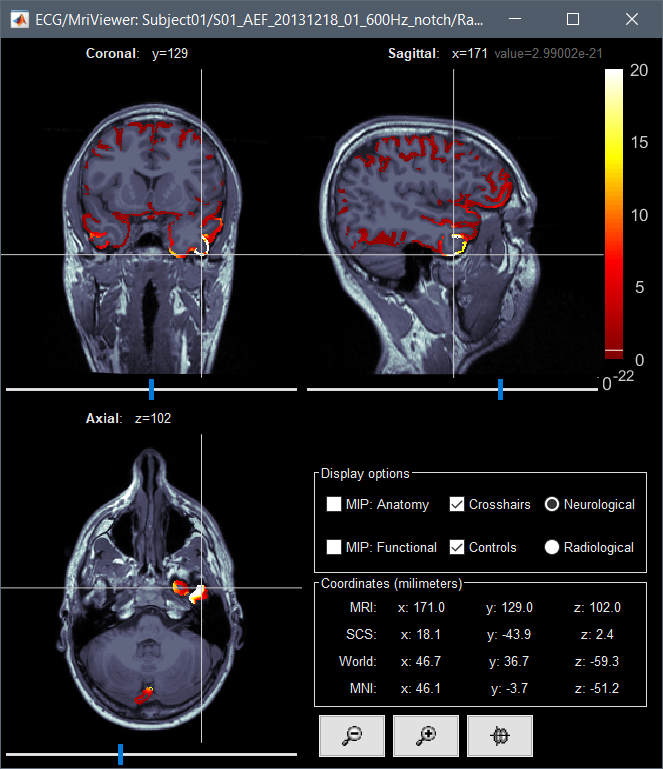
I compared the the results of whole brain FFT from one subject using constrained source model (then projected to a default anatomy) and volume source model (from the source grid I generated in group analysis), the results looks very different in MRI view.
Given the same cut off criteria, this is what it looks like from a constrained source model:
Continue with my last post because I can only post one picture in a post...
This is what it looks like from a volume source model:
I'm confused why there would be this huge difference in terms of signal strengh and source localization of the signal. Why is there also subcortical regions activation showing up in the constrained source model (it's not a mixed head model)? Do they make sense at all?
From the two images you posted, it is difficult to realize whether the results indicate different localization or not. The two figures look very different, but this is expected: in the first one you constrained both the position (a thin layer on the cortex) and the orientation of the dipoles that can explain the signals (at a given source location, if there are no dipoles with the correct orientation available, the activity might be explain by dipoles that are a bit further away bu correctly oriented).
The MRI viewer is a better tool than the 3D displays to explore these results, because it's easier to scroll through the volume, and you always see the 3 slices simultaneously. The display option "MIP: Function" (maximum intensity projection) may help for localizing the peaks of power. Add some smoothing to the re-interpolation of the surface sources in the volume to get something a bit similar to the volume sources.
Why is there also subcortical regions activation showing up in the constrained source model (it's not a mixed head model)?
When using a source model constrained to the cortical surface, it uses all the vertices of the surface as dipoles. The surfaces generated by FreeSurfer are closed: an artificial "cap" is added around the corpus callosum, therefore you also have this cap in your source space. It is artificial, but it's also good to have some dipoles at the center of the head.
If you want to design a surface-based source space without these central dipoles, you can do it with the "mixed head models", selecting only the cortex as part of the model. I don't recommend this, it just makes this analysis more complicated.
Do they make sense at all?
It is difficult to know what makes sense without any proper statistical thresholding. Run some group-level non-parametric t-tests to evaluate what is significant in your results.
Thanks! That makes sense!
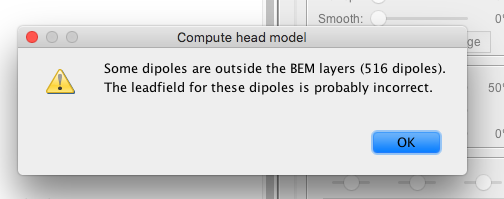
I noticed that when I compute unconstrained head model using defined source grid template, I got warning messages:
Some dipoles are outside the BEM layers, The leadfield for these dipoles is probably incorrect.
The number of dipoles vary among subjects. For the two subjects I tried so far, the number for one subject is 56 dipoles, and the number for the other subject is 655 dipoles...
How much will this affect future analysis? and is there a way I can avoid this warning from happening?
Thank you very much!
How much will this affect future analysis?
Impossible to say. Some of these dipoles may cause numerical issues on the OpenMEEG side, but most of them won't. Make sure you don't observe any abnormal peaks in the source maps around the vertices where the cortex surface is very close to the inner skull.
and is there a way I can avoid this warning from happening?
The warning gives you the answer: "Right-click on the surface file > Force inside skull"
Hi Francois,
Thanks for your reply.
The warning I got didn't have the "Right-click on the surface file > Force inside skull" suggestion. I then made sure my OpenMEEG is up to date, and I still don't see that answer in the warning I received.
My warning message looks like this:
However, I did find out if I go to anatomy view, I can right click a surface file of a subject, then "force inside skull", but after doing that, I still get the same warning when I compute head model for my subject using the source grid I created in the group analysis (this is the tutorial I followed:)
https://neuroimage.usc.edu/brainstorm/Tutorials/CoregisterSubjects#Volume_source_models
Things I've tried so far:
In subjects view --> group analysis, I right clicked the BESA channels and checked the MRI registration, made sure it looked ok.
I then go to anatomy view --> select a subject, I first right clicked the cortex_15002V --> force inside skull, and I was told all the dipoles were already inside skull, I then right clicked the cortex_288414V --> force inside skull, and then brainstorm did something, and I got a new surface file called cortex_288414V_fix.
I then followed the tutorial, and got the same warning message at the end of creating a volumn head model...
Can you give me some suggestions on this? Did I choose the wrong surface file to force inside skull?
Thank you very much!
Indeed, you get the second half of the warning only in the case of surface source models. In your case, the volume grid cannot be fixed with this menu "Force inside skull".
Can you give me some suggestions on this? Did I choose the wrong surface file to force inside skull?
Sorry, I sent you on wrong tracks with this menu "force inside skull". If you use a volume head volume and a template grid projected in the subject space, there is no easy way to fix the position of the grid points.
Keep working this way, just make sure that you don't see abnormal values at close to the skull.
Thanks Francois,
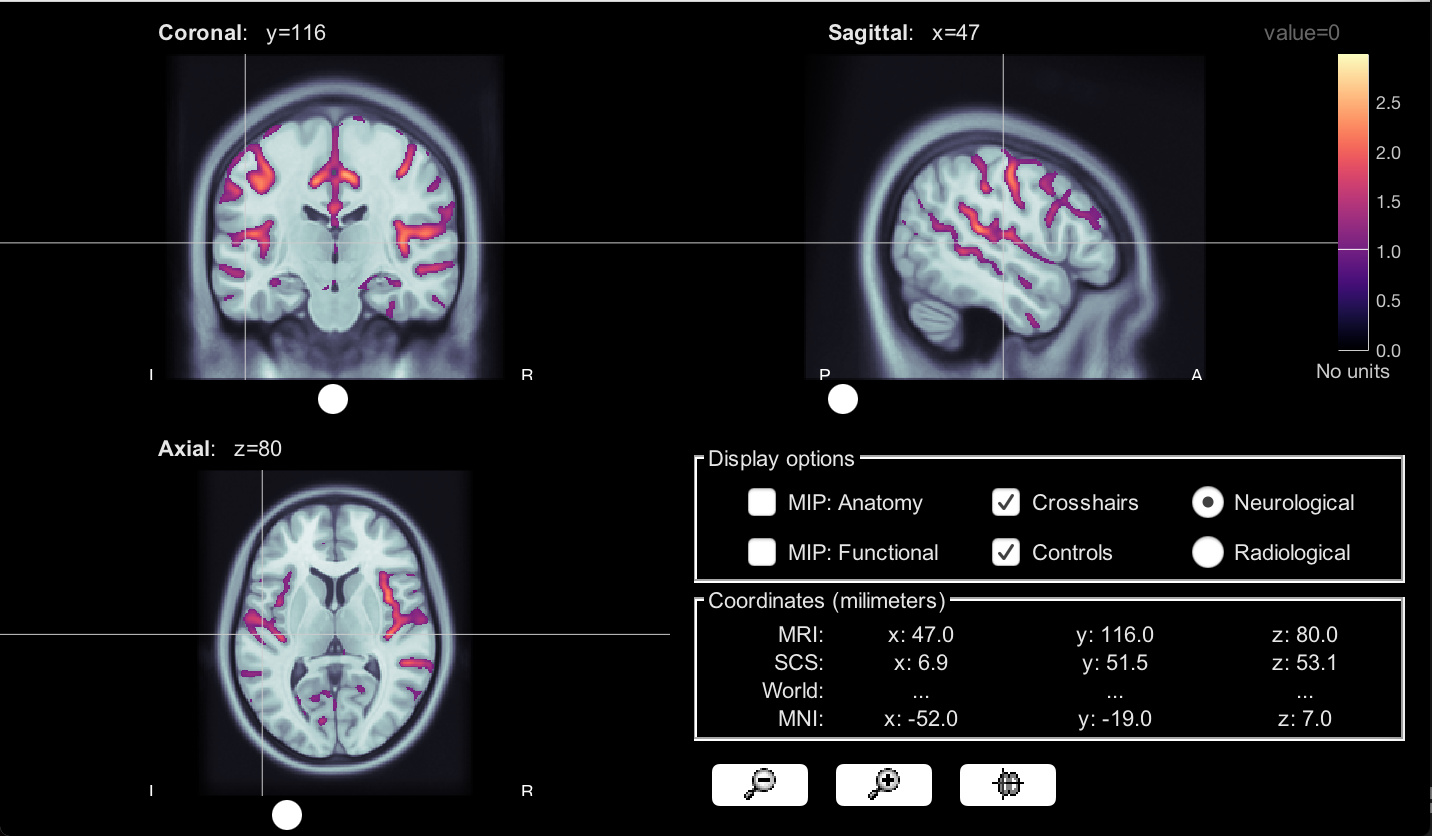
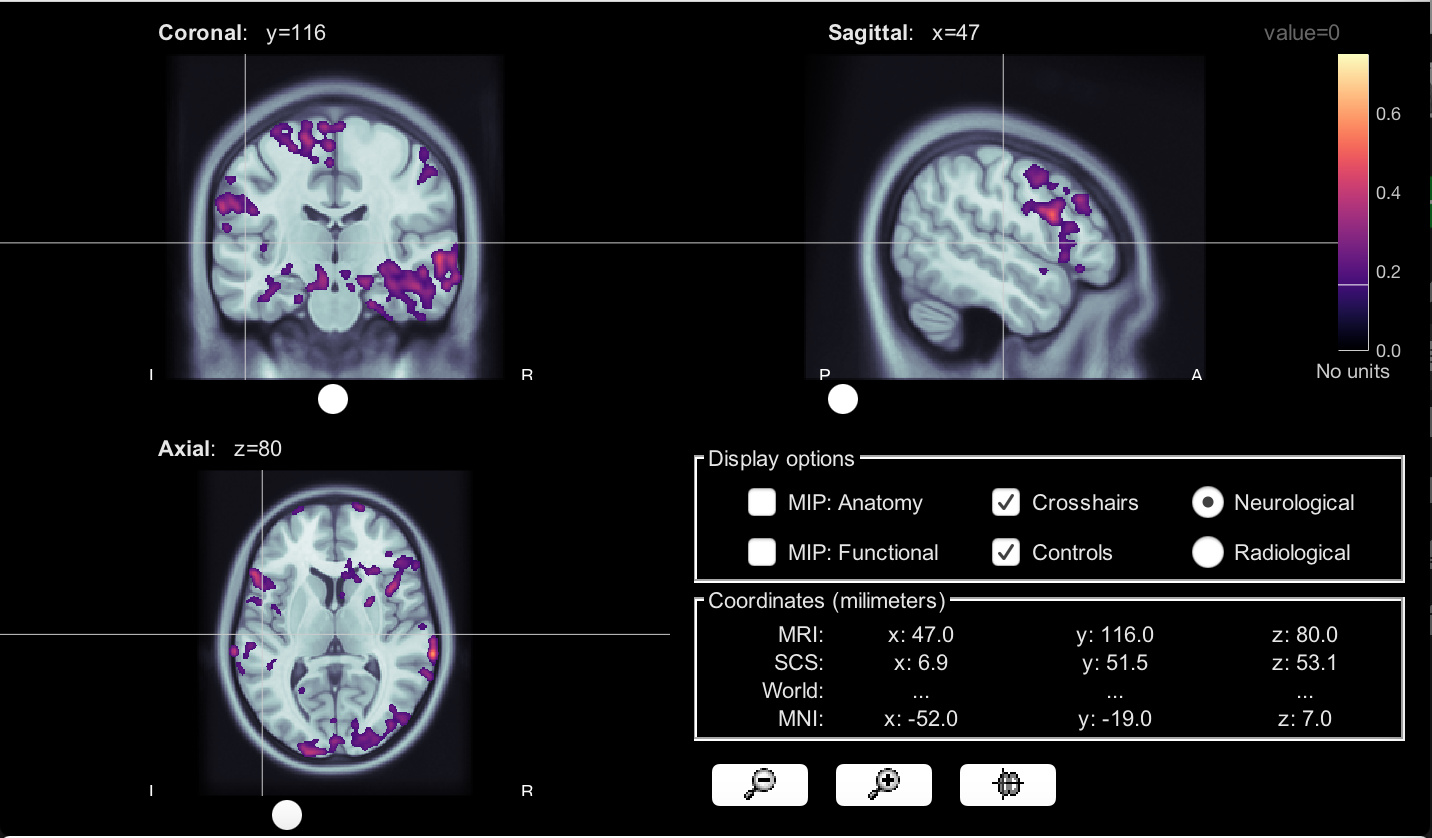
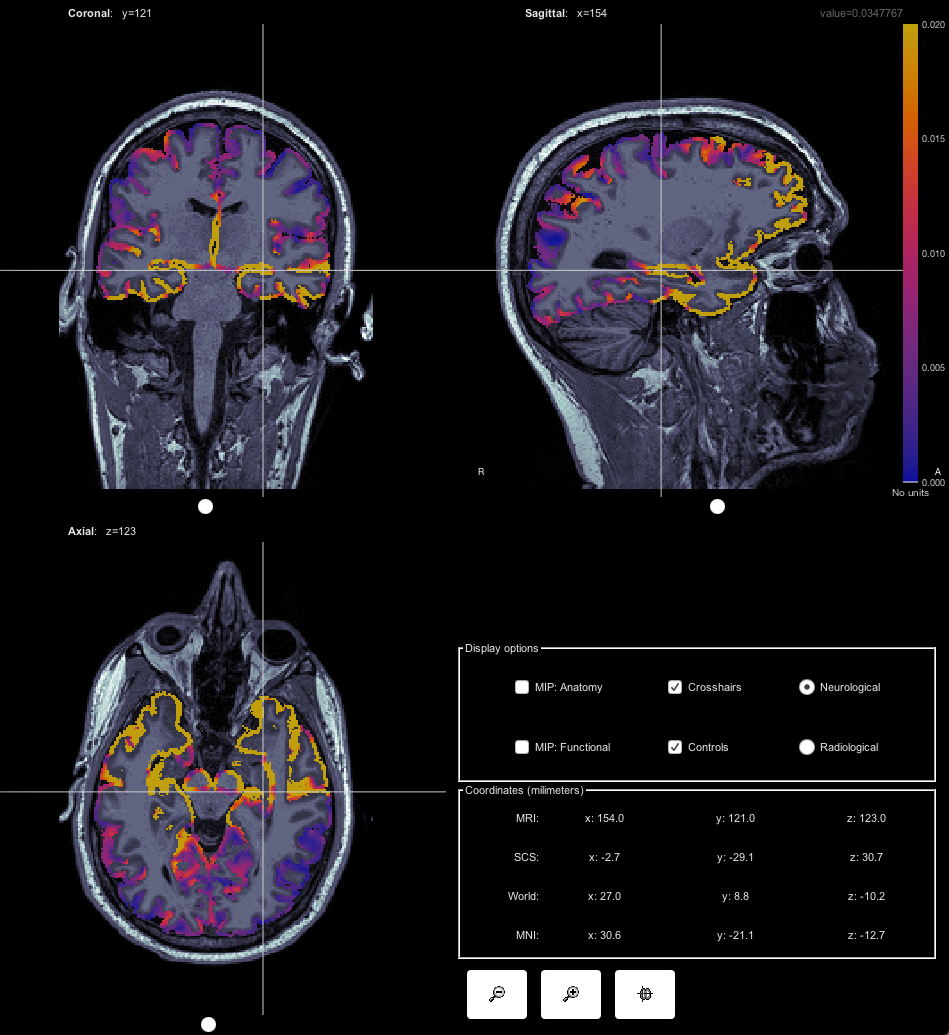
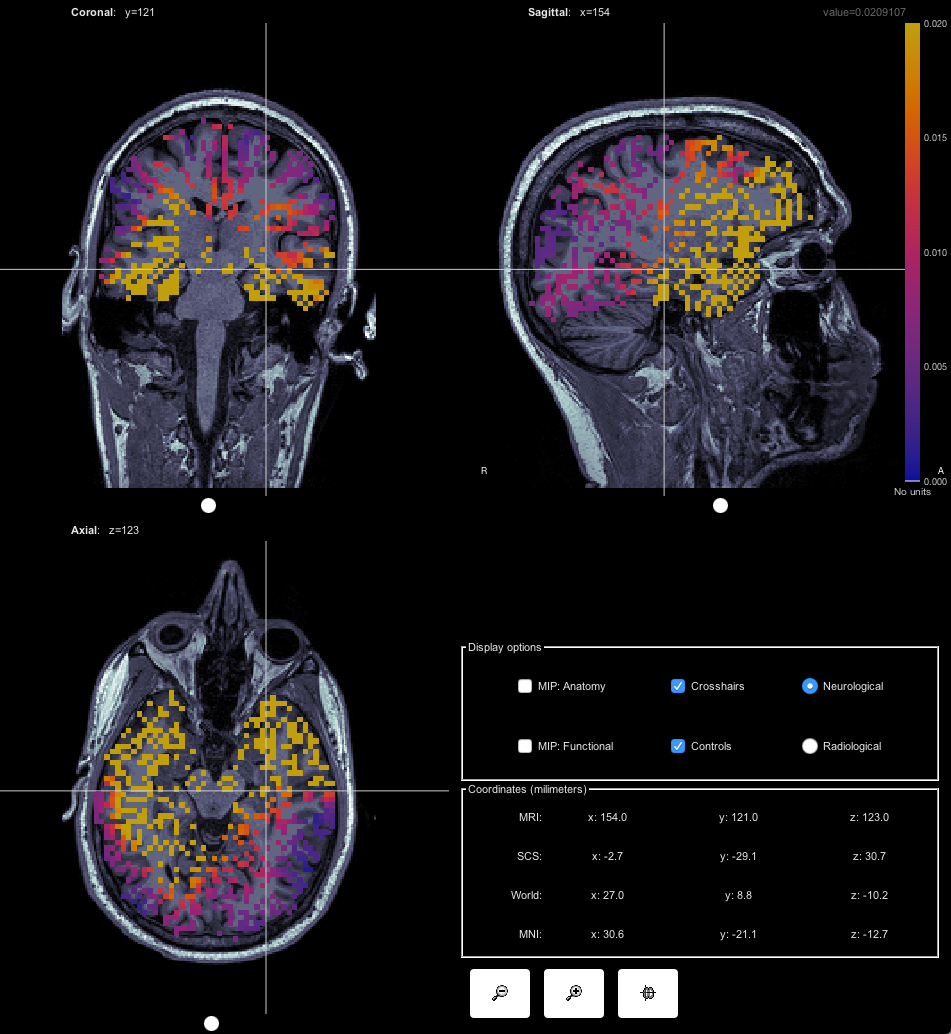
Now I've finished projecting each subject to the volume source grid, and did the group average of the FFT outside of Brainstorm (applied filter, and standardized each subject). I then mapped the new group averaged FFT back to the MRI view, and I was trying to compare the whole brain group average FFT based on volume head model and constrained head model.
Here is my question, the two group average FFTs look pretty different, both in terms of location and activation strength. For example, the plot I am showing here is a control condition in which the subjects were listening to a 2Hz metronome, so the constrained head model makes sense, as the auditory area is activated (top). However, we didn't see the same auditory area being activated in the volume head model. Also the activation strength is very different: the signal form the constrained head model is a lot stronger than the volume head model (number on the color bar is z score).
I know for the volume head model, each voxel has 3 signal directions. Am I only seeing signal strength from one direction in this group average here? or some kind of summation of all 3 directions? Are there other things I'm missing here that could explain the differences I see in these two types of head model results?
We did find subcortical area activation that we were expecting from the volume head model, so I guess my other question would be, should I only look at subcortical area activation using the volume head model, and look at cortical area activation using the constrained head model?
Group average from constrained head model, 2Hz amplitude
Group average from volume head model, 2Hz amplitude
Thanks for your time!
Avoid looking at surface results in the volume, it gives wrong impressions. The surface display would give you a better appreciation of what is going on.
number on the color bar is z score
I guess this is the measure you compute with you personal code. I won't get into the details of how you compute this.
However, we didn't see the same auditory area being activated in the volume head model
There is something weird here. You should not obtain such patchy maps. The volume power maps should be very smooth, like the one you included in a previous post. What does it look like if you set the threshold slider to 0%? And what does it look like for a single subject?
Also the activation strength is very different: the signal form the constrained head model is a lot stronger than the volume head model.
If you compute the power of a single subject in a surface/constrained head model, you should obtain the same range of values than for a volume head model. For the latter, the power along the three axes is averaged.
These differences probably come from your normalization.
We did find subcortical area activation that we were expecting from the volume head model
You said previously you were not happy with these results...?
Be careful with not overinterpreting these source results. Source estimation with EEG has a very low spatial resolution.
so I guess my other question would be, should I only look at subcortical area activation using the volume head model, and look at cortical area activation using the constrained head model?
You should be able to make similar observations in both cases. If you get very divergent results with the two approaches, I would not trust any of the two...
This is the volume head model and constrained head model comparison of one same subject, without any of my personal code process. Smooth level = 3.
Constrained head model, 2 Hz amplitude
Volume head model, 2 Hz amplitude
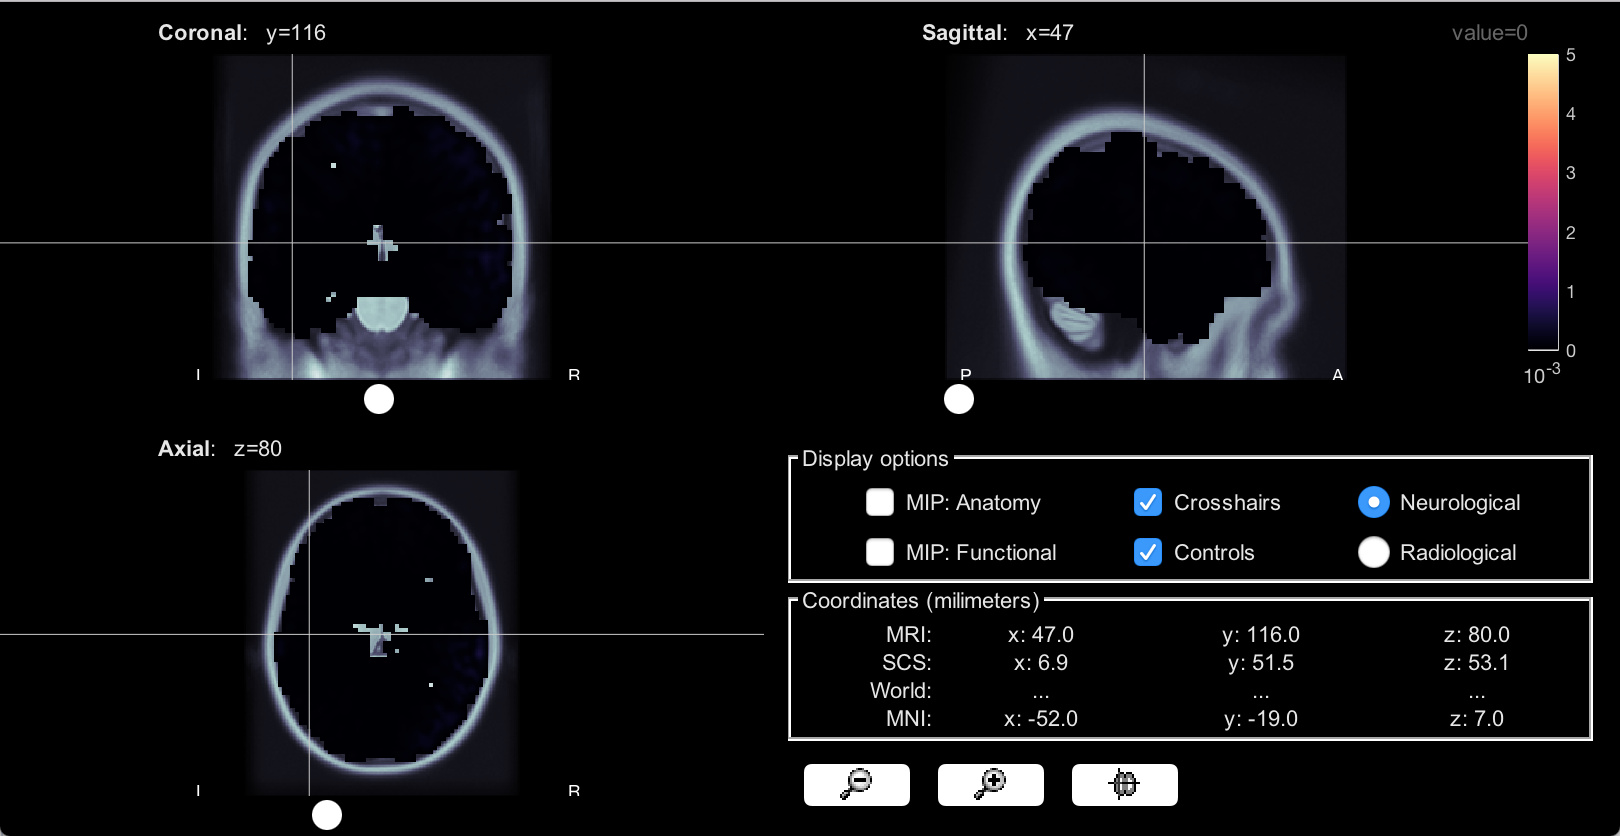
If I set the threshold slider to 0%, the volume head model looks like this:
I think I didn't explain it well earlier. We first used the constrained head model to look at cortical activations, and the activation areas made sense to us. We then moved on to use the volume head model to explore subcortical area activations. While we are seeing expected subcortical areas being activated using this volume head model, we also noticed the different activation patterns and activation strengh between these two models.
The pipelines were otherwise the same, except for the constrained head model, we computed head model for each subject first, and then project each subject's head model to a default anatomy, then down sampled it and FFT. With volume head model, we created a volume source grid first, then project each individual subject's source file to the volume source grid at group analysis level, then down sampled it and FFT. Everything was based on this tutorial.
https://neuroimage.usc.edu/brainstorm/Tutorials/CoregisterSubjects#Volume_source_models
Thanks!
It's still difficult to see anything in your screen captures. Remove the smoothing, set a colormap range and color scheme that allows to see something, select a point that has some values (see at the top-right corner), and press "=" to get the same position for the two figures.
I am still surprised by the of the volume figure: it should look much smoother than this, not with these small disconnected patches...
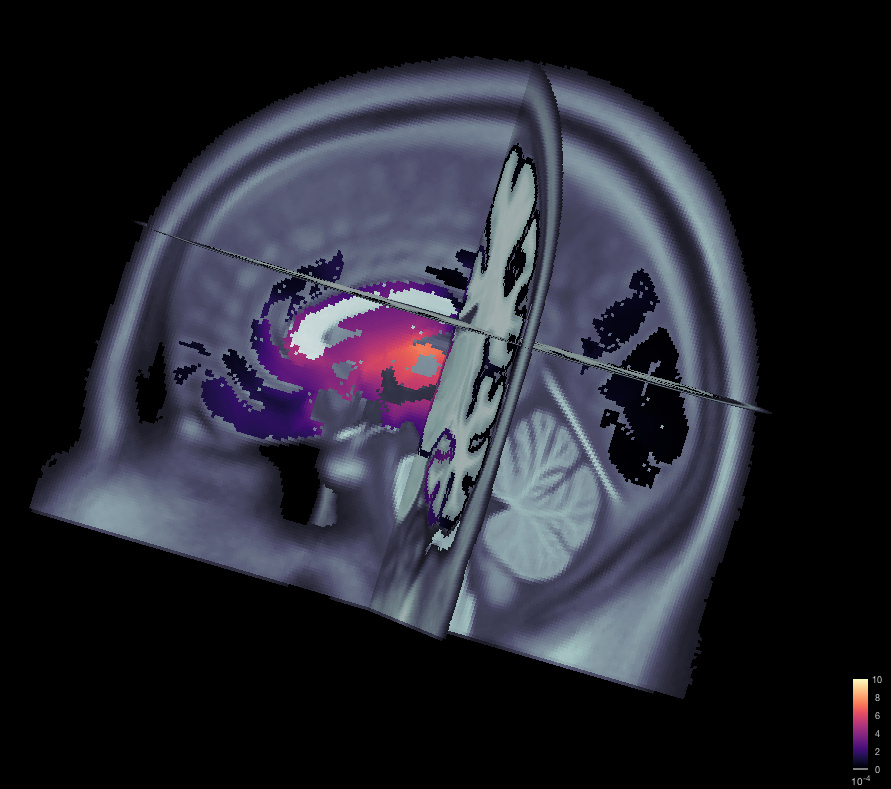
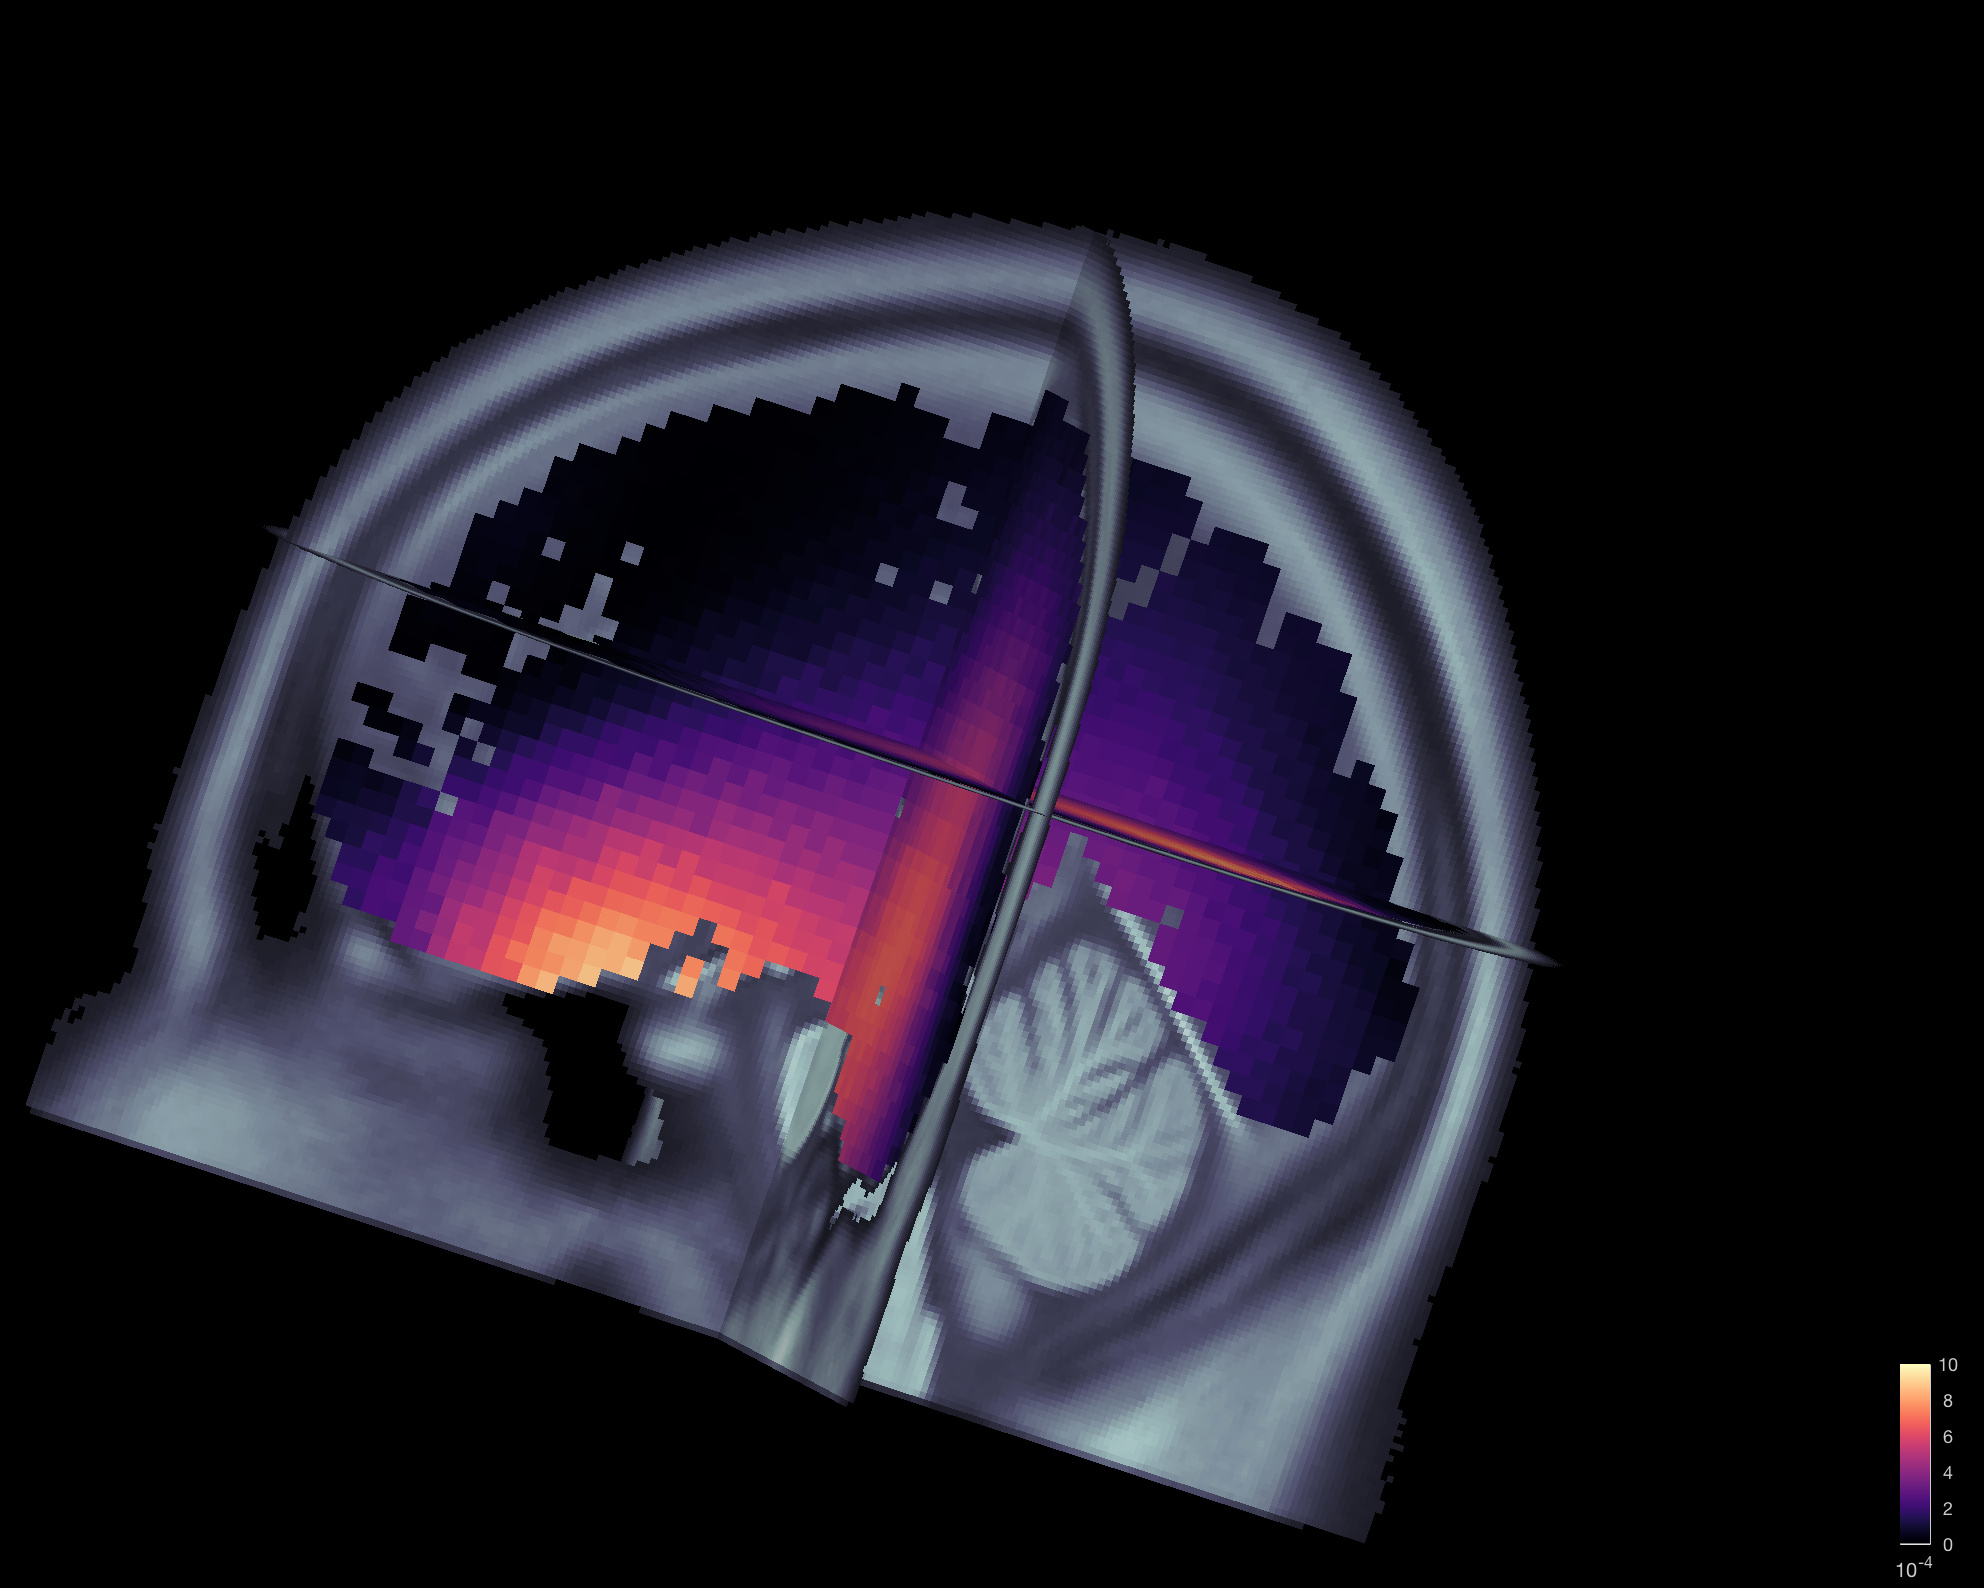
As an example, I computed the PSD of the minimum norm maps for the first 10s of the first run of the introduction tutorials (window length 2s), constrained source model from the tutorial (15000V) and isotropic brain volume grid (5mm, 13000V=39000 dipoles), you should be able to reproduce this easily these results:
It is normal that you observe lower maximum values for the volume maps (2-3x lower). There is most of the time a larger number of dipoles that get the same activity distributed, resulting in a lower power for each dipole. But if you sum the total power in a region, you should find similar values...
The sum of the 3 orientations is computed here, place a breakpoint at this line to understand what is happening: brainstorm3/toolbox/timefreq/bst_timefreq.m at master · brainstorm-tools/brainstorm3 · GitHub
Hi Francois,
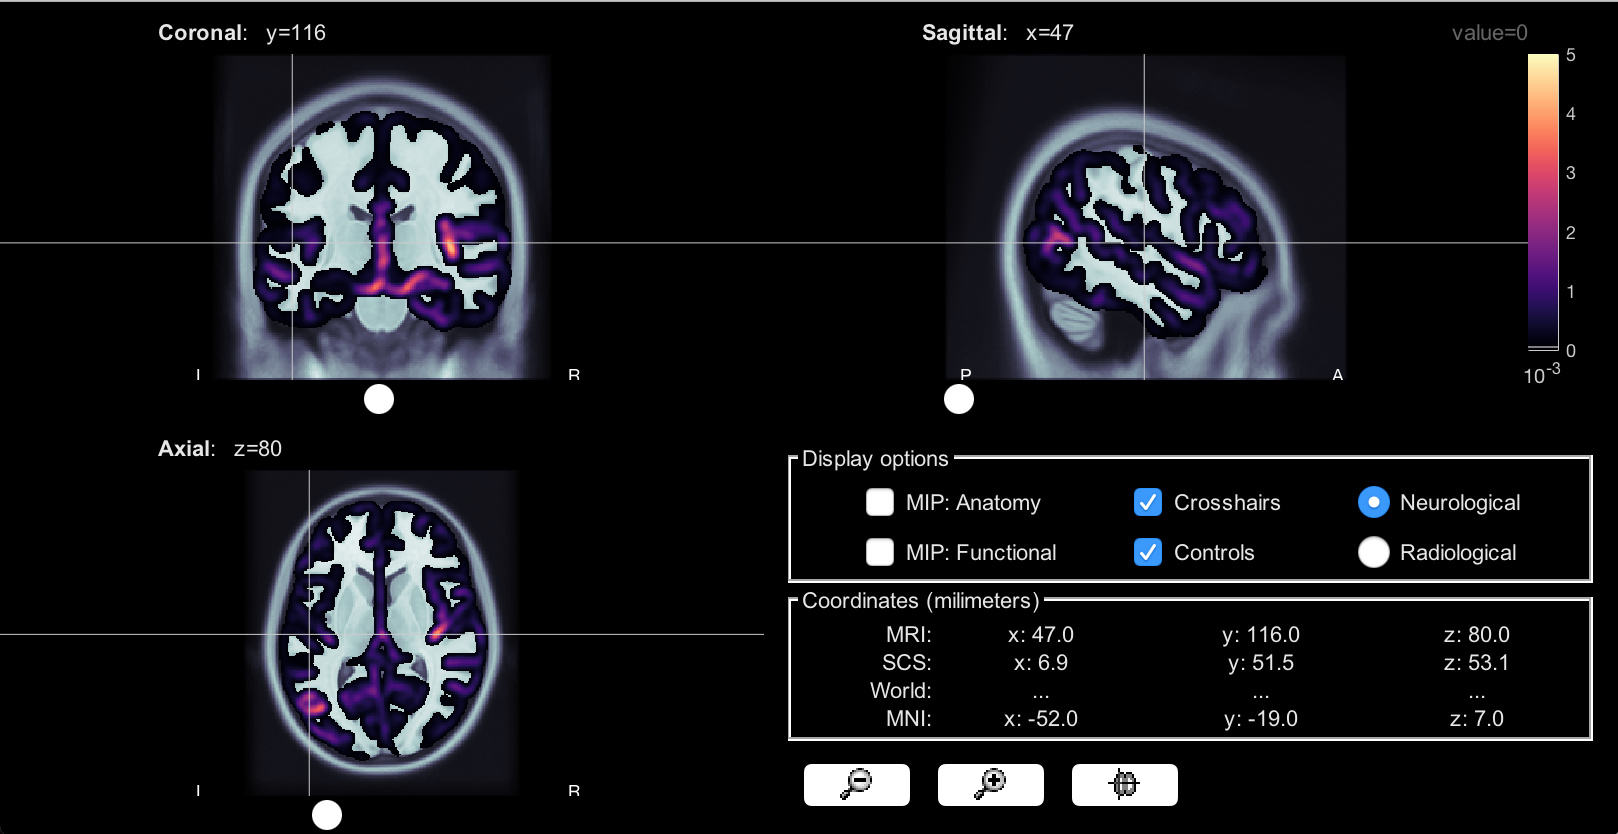
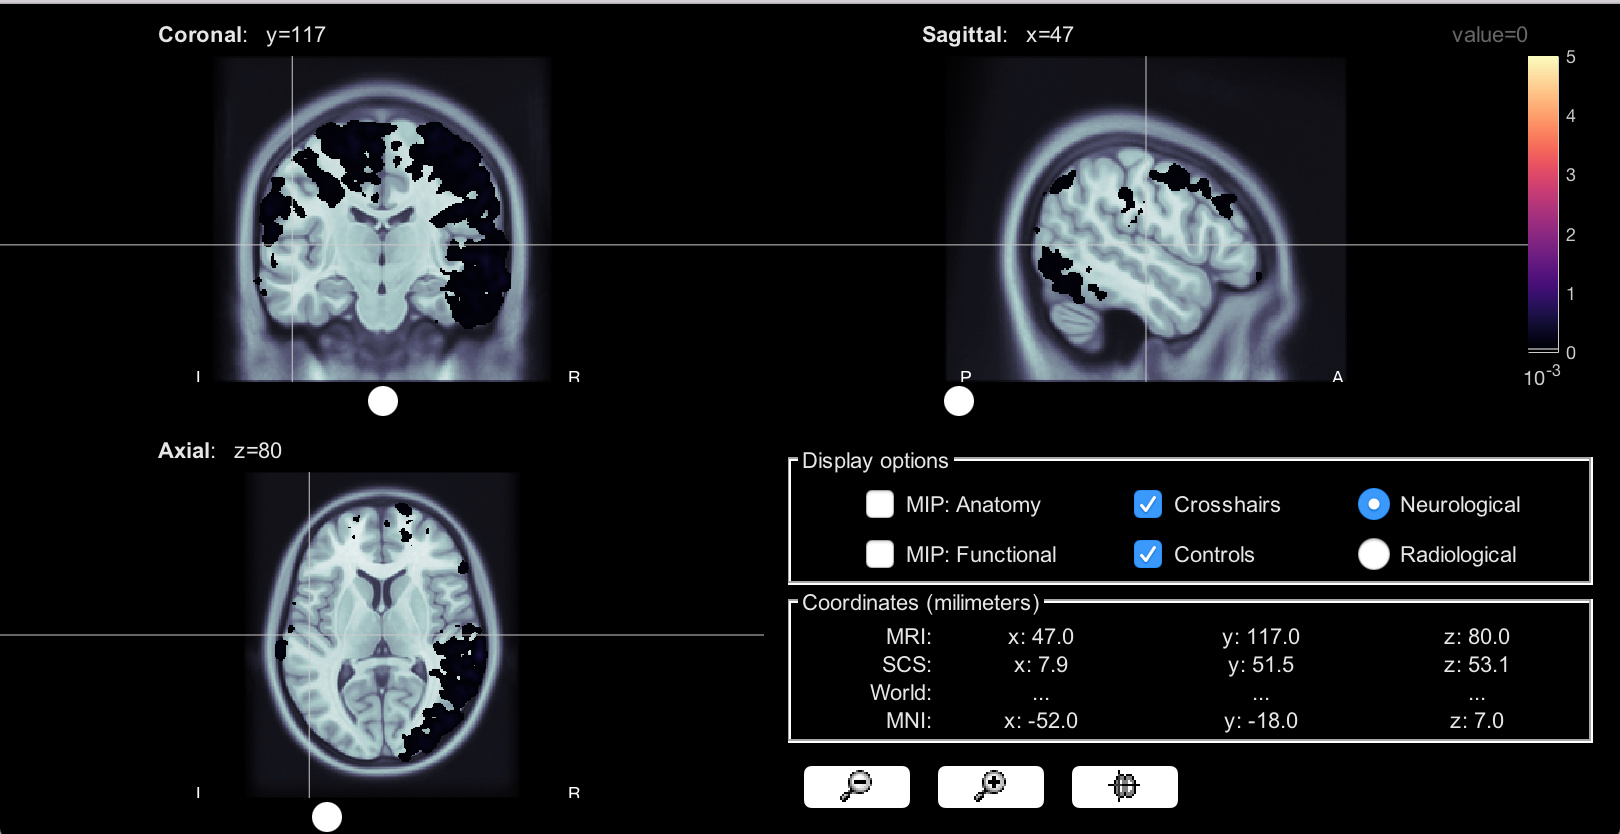
I looked at my volume head model at individual subject's level and it's still looking weird.
I wanted to take a couple steps back, so I just made volume head models, computed sources, and that's it. The screen shot here is one subject's source data using volume head model, using this subject's own MRI scan. Even without any threshold, no smoothing here as well, it seems like a lot of voxels are missing...with a zero threshold, all voxels should have some color, right? The source data using a constrained surface head model still makes sense, I attached the screen shot here as well for comparison.
I tried this on two subjects, and they both look like this.
I also inspected the ImagingKernel matrix for zeros or NaNs, and didn't find any. When I multiply that matrix by the EEG matrix, all the source-space time series I looked at seem fine, but I didn't look exhaustively.
Any thoughts you have about this would be appreciated, when you have a chance. Thanks,
Yi
The patchy display obtained with the volume sources simply shows were your dipoles really are. Around each dipole in the source model, a few voxels are painted with the value for this dipole. With a MRI volume with a spatial resolution ~1x1x1mm, an isotropic grid with a 5mm spacing this covers the entire MRI slices (as in the screen captures I posted). With a MRI with a higher resolution (which is your case I guess) and this adaptive grid point position, the results is more sparse.
I'd recommend you use an isotropic grid it would give you at least more regular displays. And either use a higher grid density or downsample the MRI before importing it in Brainstorm (or process it with FreeSurfer to get an output of 256x256x256) if you want something that shows a continuous tiling in the entire brain volume.
What you observe is not wrong, it really shows what is computed.
To me, the two screen captures you posted look equivalent. They converge and point at the same brain sources, but using different computation and display methods.