Hi,
I tryed to do statistics on source time-frequency transforms. I included only 2 people per condition (whole brain, not scout) but got the following error message:
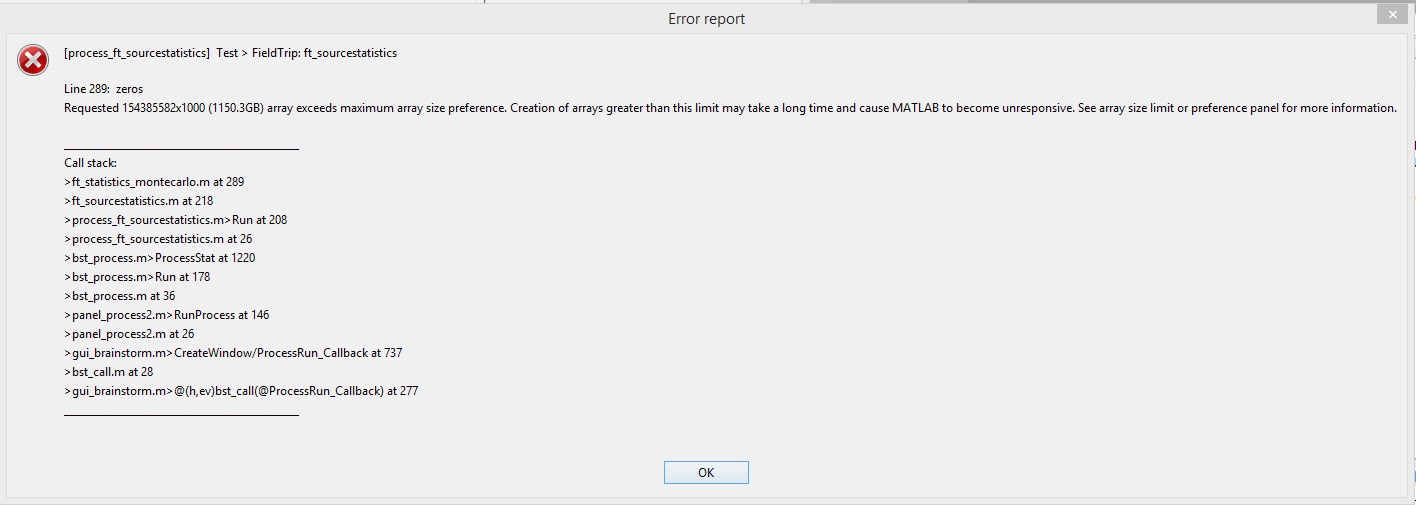
Thanks
Hi,
I tryed to do statistics on source time-frequency transforms. I included only 2 people per condition (whole brain, not scout) but got the following error message:
Thanks
Permutation statistics are typically not possible on such large datasets.
You need to test only ROI or one frequency band at a time.
Ok, thanks Francois.
Hi Francois,
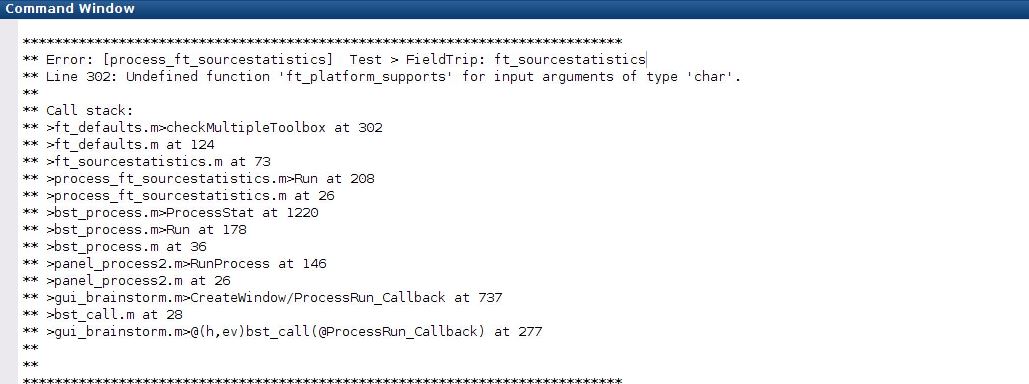
I also have a problem with FieldTrip_ftsourcestatistics.
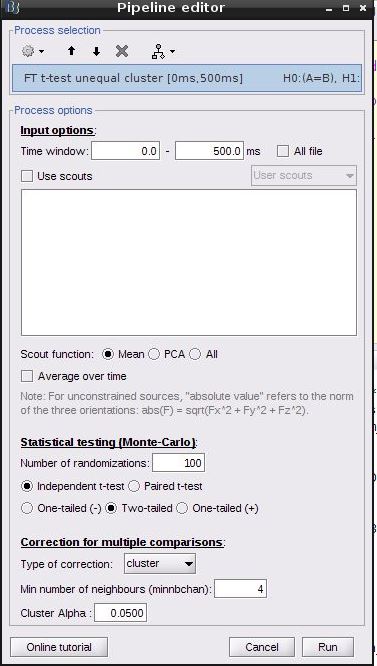
I tried the following options
Tom
Check your FieldTrip installation.
In case of doubt, delete the existing and download a new one from the website.
I just deleted my FieldTrip Version and downloaded a new one, as you said.
Unfortunetely the problem is still there.
Hello Francois,
I just ran into the same problem of arrays too big;
So, what is the pipeline you would suggest to use this only on one ROI? It this related to creating a scout?
Design is within subjects, with two conditions (seen / unseen) and would like to do an initial quality check of the signal in V1 (to start with).
Thanks!
Create a scout, and test only the values for this scout.
Do you need any additional guidance with this?
Thanks Francois;
The tutorial on how to create the Scouts is extremely clear, and have no problem with that (actually having a lot of fun).
For the testing part I am following:
If I plot the histograms / qqplots I see that the distributions are not normal; then I should go for a non parametric test.
However, now that I have only one file per condition (group average), so I can’t run any statistic differently than the comparisons of the mean. What would you suggest?
What tests would you like to perform?
Brainstorm is not very rich in terms of statistical tests… If you want to do something more advanced, you can also export the values to another program (SPM, R, Matlab statistics toolbox…)
Thanks for the prompt reply,
The idea was to compare within an ROI (e.g., right V1) whether greater activity in condition A (stimuli supra-threshold actually seen by the participants) compared to condition B (stimili supra-threshold unseen by the participants).
I believe the right approach should be to do some permutation across all the vertexes of the ROI and time points (about 900 ms) and see whether there is a different activity across the two conditions.
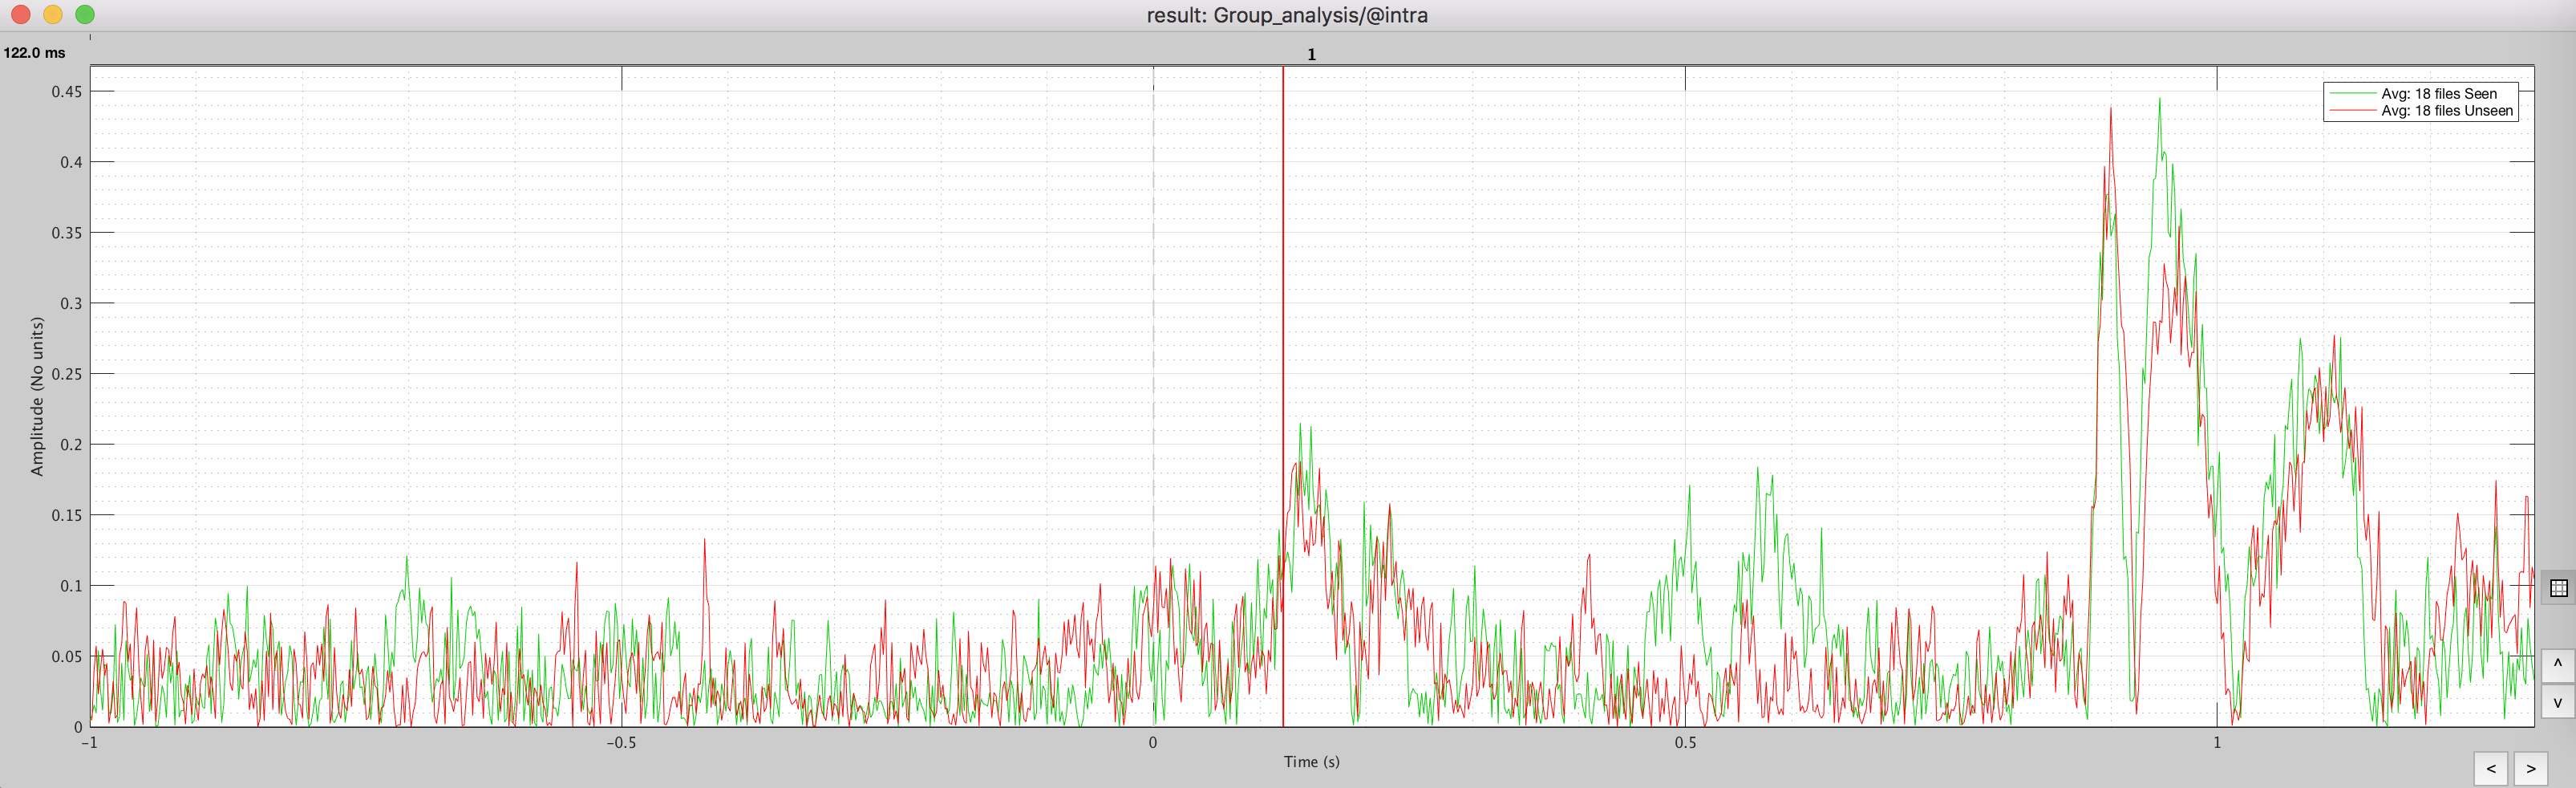
I am posting the "extract time series" plot from the averages of the 18 sbjs to each condition.
There is clearly a difference in the "signals" between the two conditions around 200 ms and then at around 800-900ms after 0 (the first stimulus), but I don't know whether that's significant.
Overall, I am trying to do a "quality" check of my data after conducting the source reconstruction, to get a sense whether this data "make sense" or "I might have done something wrong" somewhere.
It's already good that you observe the effect you were expecting in the averages.
Maybe you could filter a bit your signal, that could help observing more stable differences, similarly to what was done in this study:
https://neuroimage.usc.edu/brainstorm/Tutorials/VisualGroupOrig#Subject_averages:_Filter_and_normalize
Do not use blindly this arbitrary 32Hz, try to use something similar to the literature in this domain.
do some permutation across all the vertexes of the ROI and time points
Permutations between nearby vertices or time points are not an interesting test: we expect these measures to be very similar, and consider them as "multiple comparisons" in the statistics. You'd rather average the vertices within your ROI and the time points within your time windows of interest, and then test across subjects (if you have multiple subjects) or across trials (for a single subject study).
Additional guidelines for the statistical analysis:
https://neuroimage.usc.edu/brainstorm/Tutorials/Workflows
https://neuroimage.usc.edu/brainstorm/Tutorials/VisualGroupOrig
Thanks Francois,
Hoping not to be OT with this question:
In the tutorial above I see we use the Faces - Scrambled difference. That’s pretty clear and I can totally follow it to analyze my Seen - Unseen and my Valid - Invalid main effects.
However I am not sure how to proceed in a 2 x 2 factorial design when I would like to compute an interaction term such as (A2B2 - A1B2) - (A2B1 - A1B1).
Should I compute all these differences right at the beginning fo the workflow, i.e., estimate the Difference A-B of Seen Valid - Seen Invalid, the Unseen Valid - Unseen Invalid, and then the Difference A-B of these two files per each subject?
Thanks!