
|
Size: 24046
Comment:
|
Size: 24042
Comment:
|
| Deletions are marked like this. | Additions are marked like this. |
| Line 244: | Line 244: |
| Line 247: | Line 246: |
| On a similar note, the '''sampling rate''' of the data is also not an easy choice to make. Even though too low sampling rate will eliminate possible dynamics of the data, if the sampling rate is too high the model will be computationally very expensive, as a very high model order will be required. For most MEG / EEG data, a sampling rate between 200 and 1000 Hz will probably suffice ([[URL|Cohen, 2014]]). As mentioned in the introduction, the current model is based on the assumption of stationarity. Therefore it is important to first check if the time series we are using are stationary with statistical tests such as the [[https://en.wikipedia.org/wiki/KPSS_test|KPSS test]] or the [[https://en.wikipedia.org/wiki/Dickey%E2%80%93Fuller_test|Dickey-Fuller (unit root) test]]. If the data is shown to be non-stationary, certain techniques can still render it stationary (depending on the type of non-stationarity). A common approach is to difference the data to eliminate any trends in the time series (i.e., $x_t^{'}=x_{t}-x_{t-1}$). This can be done several times if necessary. A problem with this is that it could potentially change the interpretation of any resulting GC, specifically in the frequency domain where differencing acts as a high filter. Other commonly used methods are smoothing or filtering the data, but in the end if there are causal relation that vary over time these technique will make it impossible to find those. An alternative approach could be to divide the data into time-series that are (sufficiently) locally stationary, and apply the GC per time window. This method makes is possible to study changes in connectivity over time, but it is of course not without its own problems, the most important of which is the choice of the '''time window'''. If the time window is too short, there will not be enough data points to make a decent estimation. | On a similar note, the '''sampling rate''' of the data is also not an easy choice to make. Even though too low sampling rate will eliminate possible dynamics of the data, if the sampling rate is too high the model will be computationally very expensive, as a very high model order will be required. For most MEG / EEG data, a sampling rate between 200 and 1000 Hz will probably suffice ([[URL|Cohen, 2014]]). As mentioned in the introduction, the current model is based on the assumption of stationarity. Therefore it is important to first check if the time series we are using are stationary with statistical tests such as the [[https://en.wikipedia.org/wiki/KPSS_test|KPSS test]] or the [[https://en.wikipedia.org/wiki/Dickey–Fuller_test|Dickey-Fuller (unit root) test]]. If the data is shown to be non-stationary, certain techniques can still render it stationary (depending on the type of non-stationarity). A common approach is to difference the data to eliminate any trends in the time series (i.e., $x_t^{'}=x_{t}-x_{t-1}$). This can be done several times if necessary. A problem with this is that it could potentially change the interpretation of any resulting GC, specifically in the frequency domain where differencing acts as a high filter. Other commonly used methods are smoothing or filtering the data, but in the end if there are causal relation that vary over time these technique will make it impossible to find those. An alternative approach could be to divide the data into time-series that are (sufficiently) locally stationary, and apply the GC per time window. This method makes is possible to study changes in connectivity over time, but it is of course not without its own problems, the most important of which is the choice of the '''time window'''. If the time window is too short, there will not be enough data points to make a decent estimation. |
Granger causality
Authors: Hossein Shahabi and Raymundo Cassani
This tutorial extends the information provided in the connectivity tutorial regarding the formulation of (temporal and spectral) Granger causality. Moreover, an numeric example based on simulated signals is provided to verify the results obtained with GC in time and frequency domain.
Contents
Mathematical background
Granger causality (GC) is a method of functional connectivity, adapted by ?Clive Granger in the 1960s, but later refined by ?form that is used today. Granger causality was originally formulated in economics, but has caught the attention of the neuroscience community in recent years. Before this, neuroscience traditionally relied on lesions and applying stimuli on a part of the nervous system to study it’s effect on another part. However, Granger causality made it possible to estimate the statistical influence without requiring direct intervention (Bressler and Seth, 2011).
By definition, Granger causality is a measure of linear dependence, which tests whether the variance of error for a linear autoregressive model estimation (AR model) of a signal  can be reduced when adding a linear model estimation of a second signal
 . If this is true, signal has a Granger causal effect on the first signal , i.e., independent information of the past of improves the prediction of above and beyond the information contained in the past of alone. The term independent is emphasized because it creates some interesting properties for GC, such as that it is invariant under rescaling of the signals, as well as the addition of a multiple of to . The measure of Granger Causality is nonnegative, and zero when there is no Granger causality (?Geweke, 1982).
The main advantage of Granger causality is that it is an directed measure, in that it can dissociate between  versus
 . It is important to note however that though the directionality of Granger causality is a step closer towards measuring effective connectivity compared to non-directed measures, it should still not be confused with “true causality”. Effective connectivity estimates the effective mechanism generating the observed data (model based approach), whereas GC is a measure of causal effect based on prediction, i.e., how well the model is improved when taking variables into account that are interacting (data-driven approach) (?Barrett and Barnett, 2013).
The difference with causality is best illustrated when there are more variables interacting in a system than those taken into account in the model. For example, if a variable  is causing both and , but with a smaller delay for than for , then a GC measure between and would show a non-zero GC for , even though is not truly causing (?Bressler and Seth, 2011).
IMAGE
GC in time domain
Even though GC has been extended for nonlinear, multivariate and time-varying conditions, in this tutorial we will stick to the basic case, which is a linear, bivariate and stationary model defined in both the time and spectral domain. In the time domain this can be represented in the following way. If represents a signal that can be modelled using a linear AR model in the following two ways:

Where  is the model order, and represents the amount of past information that will be included in the prediction of the future sample. In these two equations, the first model for uses the past (and present) of only itself whereas the second includes the past (and present) of a second signal . Note that when only past measures of signals are taken into account (
 ), the model ignores simultaneous connectivity, which makes it less susceptible to volume conduction (?Cohen, 2014). Then, according to the original formulation of GC, the measure of GC from to is defined as:
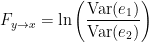
Which is 0 for  and a non-negative value for
 . Note that
 always holds, as the model can only improve when adding new information.
GC in frequency domain
An important improvement by Geweke was to show that under fairly general conditions,  can be decomposed by frequency. If the two AR models in time domain are specified as:

In each equation the reduced model can be defined when each signal is an AR model of only its own past, with error terms  and
 . Then we can defined the variance-covariance matrix of the whole system as:

where  , etc. Applying the the Fourier transform to these equations, they can be expressed as:

Rewriting this as

Where  is the transfer matrix. The spectral matrix is then defined as:

Finally, assuming independence of the signals  and
 , and
 , we can define the spectral GC as:

Note that the ability to reformulate the equations in spectral domain also makes it very easy to generalize to a multivariate GC. That is why all multivariate measures of GC are defined in spectral domain. Alternative measures derived from these multivariate autoregressive estimates are ?Partial Directed Coherence (PDC) and ?Directed Transfer Function (DTF).
A few noteworthy practical issues about GC
Temporal resolution: the high time resolution offered by MEG, EEG, and intracranial EEG allows for a very powerful application of GC and also offers the important advantage of spectral analysis.
Stationarity: the GC methods described so far are all based on AR models, and therefore assume stationarity of the signal (constant auto-correlation over time). However neuroscience data, especially task based data such as event-related potentials (ERPs) are mostly non-stationary. There are two possible approaches to solve this problem. The first is to apply methods such as differencing, filtering, and smoothing to make the data stationary (see recommendation for time domain GC), although dynamical changes in the connectivity profile cannot be detected with this approach. The second approach is to turn to versions of GC that have been adapted for non-stationary data, either by using a non-parametric estimation of GC, or through measures of time-varying GC, which estimate dynamic parameters with adaptive or short-time window methods (?Bressler and Seth, 2011).
Number of variables: Granger causality is very time-consuming in the multivariate case for many variables (
 ) where
 represents the number of variables). Since each connection pair results in two values, there will also be a large number of statistical comparisons that need to be controlled for. When performing GC in the spectral domain, this number increases even more as statistical tests have to be performed per frequency. Therefore it is usually recommended to select a limited number of ROIs or electrodes based on some hypothesis found in previous literature, or on some initial processing with a more simple and less computationally heavy measure of connectivity.
Pre-processing: The influence of pre-processing steps such as filtering and smoothing on GC estimates is a crucial issue. Studies have generally suggested to limit filtering only for artifact removal or to improve the stationarity of the data, but cautioned against band-pass filtering to isolate causal influence within a specific frequency band (?Barnett and Seth, 2011).
Volume Conduction: Granger causality can be performed both in the sensor domain or in the source domain. Though spectral domain GC generally does not incorporate present values of the signals in the model, it is still not immune from spurious connectivity measures due to volume conduction (for a discussion see (?Steen et al., 2016)). Therefore it is recommended to reduce the problem of signal mixing using additional processing steps such as performing source localization, and performing connectivity analysis in source domain.
Data length: because of the extent of parameters that need to be estimated, the number of data points should be sufficient for good fit of the model. This is especially true for windowing approaches, where data is cut into smaller epochs. A rule of thumb is that the number of estimated parameters should be at least (~10) several times smaller than the number of data points.
In the next sections we present a hands-on example with simulated signals where Granger causality (in time and frequency domain) can be used. Since the GC method is based on AR modelling of signals, the simulated signals are generated with a AR model, thus providing a fair ground truth to validate the GC results.
Simulate signals
In this example, we generate a dataset for a 3-variate AR model (example 2 in the study of (?Baccala and Sameshima, 2001)). These observed time series are assumed to be generated by the equations:

Where  are zero-mean uncorrelated white processes with identical variances. Since the model order in this example is one, we can rewrite the equations in matrix form as such:

To do simulate this in Brainstorm, we use the following steps:
Select the menu File > Create new protocol > "TutorialGC" and select the options:
- "Yes, use protocol's default anatomy"
- "No, use one channel file per acquisition run (MEG/EEG)".
In the Process1 tab, leave the file list empty and click on the button [Run] (
 ) to open the Pipeline editor.
Select the process Simulate » Simulate AR signals (ARfit), and all the parameters as follows:
% Coefficient matrix A:
A1 = [ 0.5   0.3   0.4;
      -0.5   0.3   1.0;
       0.0  -0.3  -0.2];
A  = [A1];

% Intercept b:
b = [0 0 0];

% Noise covariance matrix C:
C = eye(3,3);
(figure 1)
Which is a 10 second simulation with 100Hz sampling rate. The process will give you a data file presented in Brainstorm as:
(figure 2)
When displaying the data as time-series:
(figure 3)
Process options
Subject name: Specify in which subject the simulated file is saved.
Condition name: Specify the folder in which the file is saved (default: "Simulation").
Number of time samples: number of data samples per simulation.
Signal sampling frequency: Sampling frequency of the simulated signal in Hz.
Coefficient matrix A: coefficient matrix as defined in the matrices in equations above. There are p (model order) number of A matrices, each the size [Nsignals_to, Nsignals_from]. For orders p>1, these coefficient matrices are then combined as: A = [A1, A2, ..., Ap];.
Intercept b: constant offset for each variable, as defined by a matrix with size [1, Nsignals].
Noise covariance matrix C:} covariance matrix for the error (noise) term. Since we are modelling an uncorrelated white process with identical variance, this is equivalent to an identity matrix with size [Nsignals, Nsignals].
Bivariate Granger Causality NxN in time domain}
Place the simulated data in the Process1 tab, select recordings, click on [Run] (
) to open the Pipeline editor, and select the connectivity metric.
The data generated above is then used to estimate GC. To estimate GC, drag the simulated file to the Process1 tab:
(figure 4)
Select the process Connectivity > Bivariate Granger Causality NxN Set the parameters as follows:
(figure 5)
The connectivity profile calculated is saved in the file Granger: full. Displaying this as an image will show the following:
(figure 6)
In this image, an asymmetrical matrix of GC estimates is shown, with non-negative values. Note that this map is not a multivariate analysis of our multivariate system, but instead a 3by3 bivariate analysis. It is known that bivariate connectivity measures to estimate the correct pattern of propagation in a multivariate system can be problematic, nevertheless the results still show a pretty good estimation of connectivity, as can be seen in the strong propagation of activity going from variable x3 to x2, as is the case in the originally described model. The next strong connections are from x1 to x2, and from x3 to x1. Connections x2 to x1 and x2 to x3 show the same value, as they have the same value though with negative signs. Note that the relative strengths of connectivity in the results are reserved, but the value itself is a ratio of the residual errors of the full and reduced model as described in the ?introduction, and should not be confused with the actual coefficient values. You also have the option of showing the results as a graph by right-clicking on the Granger file > Display as graph.
(figure 7)
1. You can choose the threshold for the coupling intensity shown in the right hand Display panel (Intensity Thresh).
1. To set link transparency and size, right-click on the figure: Display options
1. To detect incoming and outgoing connections, select the variable you want to see by clicking on it, and in the right hand Display panel, section direction, select Out or In.
Process options
Time window: Segment of the signal used for the connectivity analysis. Check All file.
Sensor types or names: Leave it empty.
Include bad channels: Check it.
Removing evoked response: Check this box to remove the averaged evoked. It is also recommended by some as it meets the zero-mean stationarity requirement (improves stationarity of the system). However, the problem with this approach is that it does not account for trial-to-trial variability. For a discussion see (Wang et al., 2008).
Model order: Order of the model, see recommendations in the next section. While our simulated signals were created with a model of 1, here we used as model order of 3 for a decent connectivity result.
Save individual results (one file per input file): option to save GC estimates on several files separately.
Concatenate input files before processing (one file): option to save GC estimates on several files as one concatenated matrix.
File contents
The output of the Bivariate Granger Causality NxN is an NxN matrix saved in the TF domain, and represent the coupling strength between variables. You can see these contents by right-clicking in the Granger file $>$ File $>$ View file contents.
(figure 8)
Recommendations
The model order used for GC is crucial, as too low orders may lack the necessary details, while too big orders tend to create spurious values of connectivity. The most common criteria used to define the order of the model are the Akaike’s information criterion (AIC), the Bayesian-Schwartz’s criterion (BIC), and the Hannan-Quinn criterion. As mentioned before, a model order should be selected with care. In electrophysiological data, a model order should also make some biological sense. For example in EEG data with 2 kHz sampling rate, an order of 5 would correspond to a 2.5 ms of past information incorporated to train your model, which is probably too little past information to make a decent judgement. Note that to take an arbitrary high model order is also not recommended, as it will increase the type I error. We will refrain from recommending a rule of thumb model order, but instead advise to use the information criteria such as AIC or BIC to compare model fits:
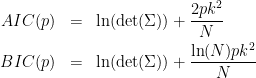
Where  is the noise covariance matrix, model order,
 number of variables, and
 is the number of data samples.
On a similar note, the sampling rate of the data is also not an easy choice to make. Even though too low sampling rate will eliminate possible dynamics of the data, if the sampling rate is too high the model will be computationally very expensive, as a very high model order will be required. For most MEG / EEG data, a sampling rate between 200 and 1000 Hz will probably suffice (?Cohen, 2014).
As mentioned in the introduction, the current model is based on the assumption of stationarity. Therefore it is important to first check if the time series we are using are stationary with statistical tests such as the KPSS test or the Dickey-Fuller (unit root) test. If the data is shown to be non-stationary, certain techniques can still render it stationary (depending on the type of non-stationarity). A common approach is to difference the data to eliminate any trends in the time series (i.e., $x_t^{'}=x_{t}-x_{t-1}$). This can be done several times if necessary. A problem with this is that it could potentially change the interpretation of any resulting GC, specifically in the frequency domain where differencing acts as a high filter. Other commonly used methods are smoothing or filtering the data, but in the end if there are causal relation that vary over time these technique will make it impossible to find those. An alternative approach could be to divide the data into time-series that are (sufficiently) locally stationary, and apply the GC per time window. This method makes is possible to study changes in connectivity over time, but it is of course not without its own problems, the most important of which is the choice of the time window. If the time window is too short, there will not be enough data points to make a decent estimation.
Bivariate Granger Causality NxN in spectral domain
To estimate GC values in spectral domain, drag your data to the Process1 tab as before. Select run $>$ Connectivity $>$ Bivariate Granger causality (spectral) NxN Set the parameters as the following
(figure 9)
To view the spectral profile for each bivariate connection pair, right-click on the SpGranger file $>$ Power Spectrum
(figure 10)
Where the first variable in the legend refers to the sender and the second to the receiver of information. As we can see from the figure the large coupling strength from 2->3 is highest in higher frequency ranges. You can select your desired connectivity pair, and then press enter to view it in a separate window.
Process options
Input options
- Time window:} same as time domain GC.
- remove evoked response from each trial:} same as time domain GC.
Estimator options
- Maximum Granger model order:} same as time domain GC.
- Maximum frequency resolution:} frequency steps of the spectral GC. A large number of steps (high resolution) will increase the number of statistical comparisons. Note that the frequency resolution has to be less than half the highest frequency of interest.
- Highest frequency of interest:} maximum frequency evaluated. Based on the Nyquist theorem, this value needs to be less than half the sampling frequency
Output options
- Save individual results (one file per input file):} same as time domain GC.
- Concatenate input files before processing (one file):} same as time domain GC.
File Contents
Files saved by this process are saved in the format links by trials by frequency
(figure 11)
Additional documentation
Articles
Bressler SL, Seth AK.
Wiener–Granger causality: a well established methodology.
Neuroimage. 2011 Sep 15;58(2):323-9.
Forum discussions
Connectivity matrix storage:http://neuroimage.usc.edu/forums/showthread.php?1796