|
Size: 7161
Comment:
|
Size: 4674
Comment:
|
| Deletions are marked like this. | Additions are marked like this. |
| Line 2: | Line 2: |
| == Featuring MEG auditory evoked responses == Acquisition on an ''Elekta'' ''Neuromag Vectorview306'', instrument. |
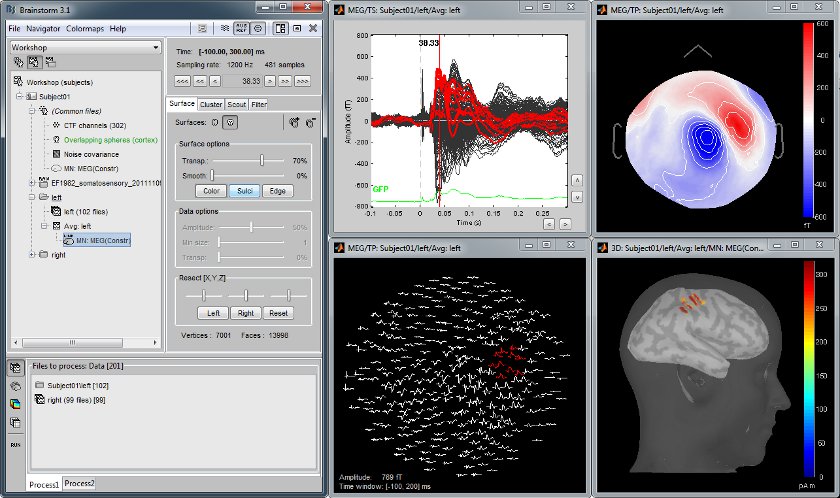
== MEG somatosensory evoked responses == Acquisition on an ''CTF 275'' instrument for a left median nerve electric stimulation. |
| Line 5: | Line 5: |
| Brief description of the following pictures: | [[attachment:snap_median.jpg|{{attachment:snap_median_sm.jpg|attachment:snap_median.jpg}}]] |
| Line 7: | Line 7: |
| * Main Brainstorm window * Time series of all MEG sensors [-200, 500] ms * Magnetic field topographty, magnetometers at t=106ms * Topographical layout of magnetometers time series [-200, 500] ms * Modeling of cortical currents, obtained from magnetometers, at t=106ms |
|
| Line 13: | Line 8: |
| [[attachment:snap_1condition.jpg|{{attachment:snap_1condition_sm.jpg|attachment:snap_1condition.jpg}}]] | |
| Line 15: | Line 9: |
| <<BR>> == Keeping your data organized and accessible == The tree in the main Brainstorm window represents the database for the selected study. This database has three levels of definition: Protocol (ie. study, selected in the toolbar), Subject, and Condition. Most of the operations that can be performed on a file are easily accessible from the popup menu revealed by right-clicking over the file. The first three buttons in the toolbar allows the user to switch between different views of the same database: * Anatomy: display the MRI and surfaces for each participant in the study * Functional data (sorted by subject): sensor definitions, MEG and EEG data, source models, statistic and time-frequency maps * Functional data (sorted by condition): same as above, but sorted in a different way The following example features a MEG+EEG protocol called "''Catching''", sorted by conditions. There are two experimental conditions, ''Catch ''and ''NoCatch'', and 7 subjects per condition. The popup menu shows all the actions that are available for the recordings of subject ''cc'', condition ''Catch''. [[attachment:snap_rightclick.jpg|{{attachment:snap_rightclick_sm.jpg|attachment:snap_rightclick.jpg}}]] <<BR>> == Multiple conditions: Baby auditory EEG responses == |
== Baby auditory EEG responses == |
| Line 34: | Line 11: |
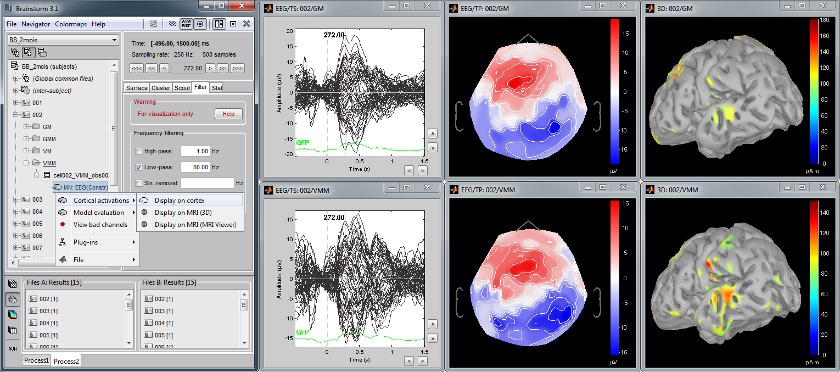
Description: * One subject: "001" * Three conditions: "GM", "GMM", "VM" * Two views: overlaid electrodes time series, and estimated cortical sources at t=376ms |
|
| Line 43: | Line 14: |
| <<BR>> | == Review continuous recordings and edit markers == |
| Line 46: | Line 19: |
| Brainstorm offers the possibility to reconstruct the cortical activity either on the individual subject anatomy, or on a default anatomy (MNI / Colin27). For this purpose, many interactive tools are available to view, register and process the MR images and the corresponding meshes. However, the cortex segmentation must be performed by an external program of your choice ([[Links|list here]]). | Brainstorm features the possibility to model MEG and EEG neural generators either from the individual subject anatomy, or by using a template anatomy (MNI / Colin27) that can be warped to the individual scalp surface. Multiple interactive tools are available to view, register and process the MR images and the corresponding tessellated envelopes. However, tissue segmentation must be performed using another software; multiple options exist today in the academic community ([[Links|listed here]]). |
| Line 48: | Line 21: |
| Here are a few examples of the views you can obtain with a simple click on a MRI or a surface. All the 3D views can be rotated freely with the mouse, zoomed with the wheel, edited with the "Surfaces panel" and with their popup menus. The MRI slices can be moved with a simple mouse operation: right-click and mouse drag. | We provide a few examples of the views you can easily obtain with Brainstorm. All the 3D views can be rotated freely with the mouse, zoomed with the wheel, edited with the "Surface panel" and contextual popup menus. The MRI slices can be browsed with a simple mouse operation: right-click and mouse drag. |
| Line 55: | Line 28: |
| All the figures displayed with Brainstorm are always linked in time; and if they represent the same dataset, the sensors selection is also the same for all the views. The selection of a channel is done by clicking on it, in a time series or a 3D view. Selected channels can be displayed separately, marked as "bad", or deleted. | All the figures displayed by Brainstorm are linked in time. If they feature the same dataset, the sensor selection is also the same for all views. The selection of a channel subset can be easily perfomed by clicking on the corresponding channels in a time series display or a 3D view. Selected channels can be displayed separately, marked as "bad", or deleted. |
| Line 68: | Line 41: |
| == Cortical region of interest: Scout == | == Defining cortical region of interest: Scout == |
| Line 71: | Line 44: |
| The ''scouts'' are subsets of the cortical vertices, defined graphically with the "''Scouts''" tab. They are useful to extract the time series of a the electrical activity of one or several brain regions. | Scouts are cortical regions of interest, defined graphically from the "Scouts" tab. They can be used to extract the time series of MEG and EEG generators within a single or mulitlple brain region. |
| Line 73: | Line 46: |
| This example shows the cortical response to an electric stimulation of the left index finger. With the two scouts ''Left ''and ''Right'' we can observe the electrical activity in the primary somatosensory cortex in both hemispheres. | The following example shows the cortical response to an electric stimulation of the left index finger. With the two scouts ''Left ''and ''Right,'' one can observe the electrical activity in the primary somatosensory cortex from each hemisphere. |
| Line 79: | Line 52: |
| == Scouts: multiple conditions == | == From surface to volume: MRI integration == |
| Line 82: | Line 55: |
| Same experiment than the previous example, but showing at the same time the responses for condition ''Left-1'' (electric stimulation of the left index) and ''Left-4'' (left ring finger). [[attachment:snap_2scouts.jpg|{{attachment:snap_2scouts_sm.jpg|attachment:snap_2scouts.jpg}}]] <<BR>> == View cortical sources in MRI == Acquisition system: ''CTF MEG - 151 sensors'' Same experiment, with additional display of the scout activity on the 3D MRI slices. |
Same experiment as above, with additional 3D display of the scout activity in MRI slices. |
| Line 97: | Line 61: |
| == Time-frequency == | == Time-frequency decompositions == |
| Line 100: | Line 64: |
| Time-frequency decompositions at the sensor or the source level, on small regions of interest or in full resolution. | Time-frequency decompositions of sensor data and source time series, extracted from cortical regions of interest. |
| Line 106: | Line 70: |
| == Statistical analysis: z-score == | == Statistical inference: t-test maps == |
| Line 109: | Line 73: |
| The "''Processes''" tab in the main Brainstorm window allows the user to apply several functions to a set of recordings of sources files. Drag and drop files from the database tree to the white box in the "Processes" tab, and click on "''Run''" to process them. | The "''Processes''" tab can also be used for running statistical tests e.g., to evaluate contrasts between two experimental conditions. |
| Line 111: | Line 75: |
| The function that was applied here is a z-score statistic. The algorithm is the following. | The following example features the evaluation of the difference between conditions ''GM'' and ''GMM'', from the source maps of mulitple subjects (paired Student t-test, p<0.05). The top figure shows the significance of the difference at the sensor level across time. The bottom figure displays the thresholded t-values at the cortical level at 280ms. |
| Line 113: | Line 77: |
| For each channel: * Compute the mean ''m'' and the variance ''v'' for the baseline * For all the time samples: substract ''m'' and divide by ''v'' The top-right figure represents the initial sources estimate, and the bottom-left figure shows the z-score values for those sources. [[attachment:snap_zscore.jpg|{{attachment:snap_zscore_sm.jpg|attachment:snap_zscore.jpg}}]] <<BR>> == Statistical analysis: t-test == Acquisition system: ''EGI GSN - Baby 64 electrodes'' The "''Processes''" tab can also be used for computing statistical tests, to evaluate the differences between two experimental conditions. This example shows the evaluation of the difference between conditions ''GM'' and ''GMM'', using the results of many different subjects (paired Student t-test, p<0.05). The top figure represents the significance of the difference at the electrodes level across the time, and the bottom figure the thresholded t-values at the cortical level at 280ms. This image also illustrates the "''Coordinates''" tab. It is possible to pick any point from any surface by clicking on it, and immediately get its coordinates in all the coordinates systems used by Brainstorm (MRI, Subject's head and Talairach). |
This image also illustrates the "''Coordinates''" tab: It is possible to pick any point from any surface by clicking on it, and immediately get its coordinates in all the coordinates systems used by Brainstorm (MRI, Subject's head and Talairach). |
| Line 136: | Line 82: |
Scripting environment Everything that can be done in the interface with mouse clicks can be converted automatically to Matlab scripts, using the Process1 and Process2 tabs. [[attachment:snap_scripting.jpg|{{attachment:snap_scripting_sm.jpg|attachment:snap_scripting.jpg}}]] |
Screenshots
MEG somatosensory evoked responses
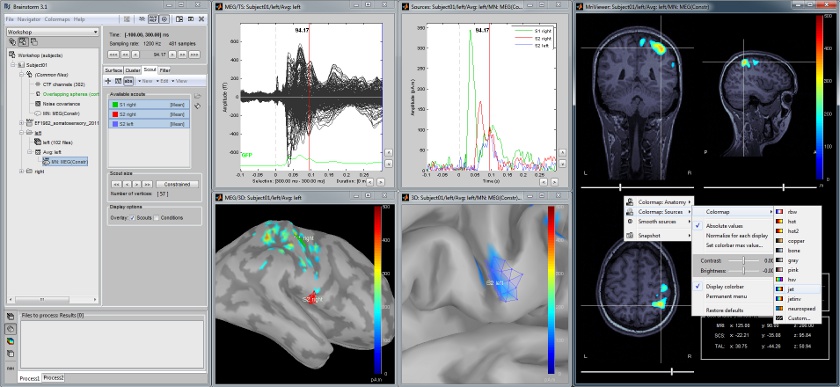
Acquisition on an CTF 275 instrument for a left median nerve electric stimulation.
Baby auditory EEG responses
Acquisition system: EGI GSN - Baby 64 electrodes
Review continuous recordings and edit markers
Subject anatomy: MRI and surfaces
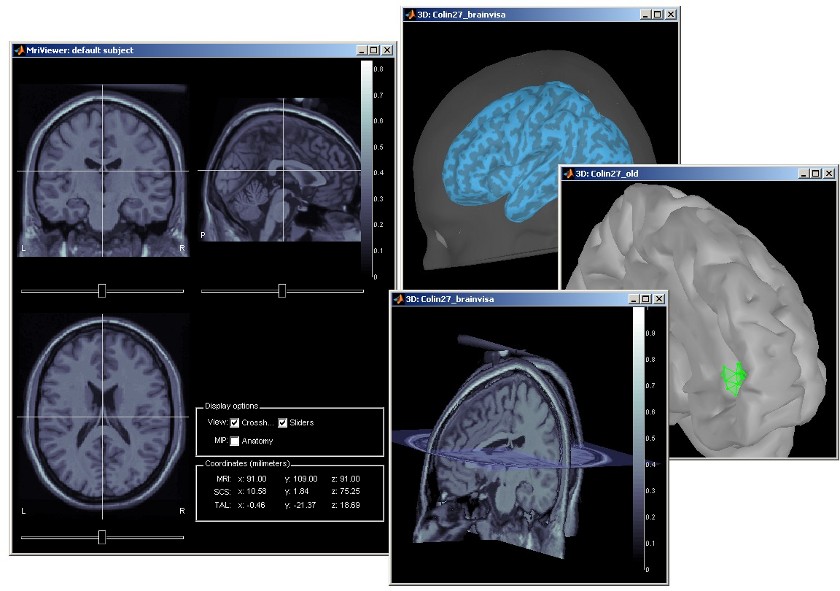
Brainstorm features the possibility to model MEG and EEG neural generators either from the individual subject anatomy, or by using a template anatomy (MNI / Colin27) that can be warped to the individual scalp surface. Multiple interactive tools are available to view, register and process the MR images and the corresponding tessellated envelopes. However, tissue segmentation must be performed using another software; multiple options exist today in the academic community (?listed here).
We provide a few examples of the views you can easily obtain with Brainstorm. All the 3D views can be rotated freely with the mouse, zoomed with the wheel, edited with the "Surface panel" and contextual popup menus. The MRI slices can be browsed with a simple mouse operation: right-click and mouse drag.
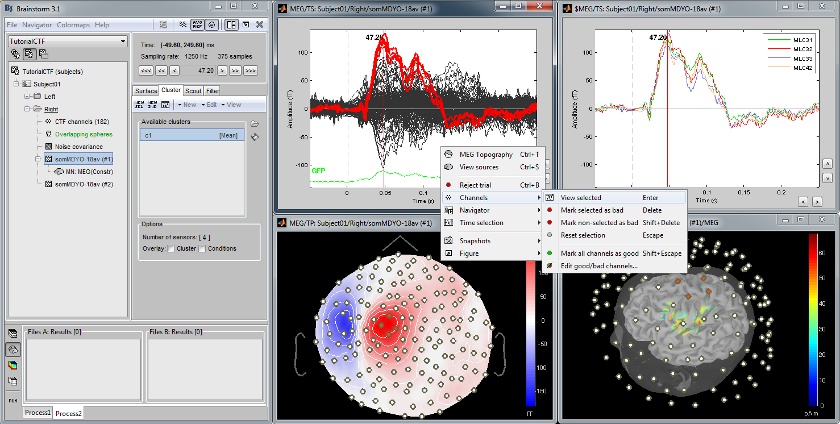
Channel selection
All the figures displayed by Brainstorm are linked in time. If they feature the same dataset, the sensor selection is also the same for all views. The selection of a channel subset can be easily perfomed by clicking on the corresponding channels in a time series display or a 3D view. Selected channels can be displayed separately, marked as "bad", or deleted.
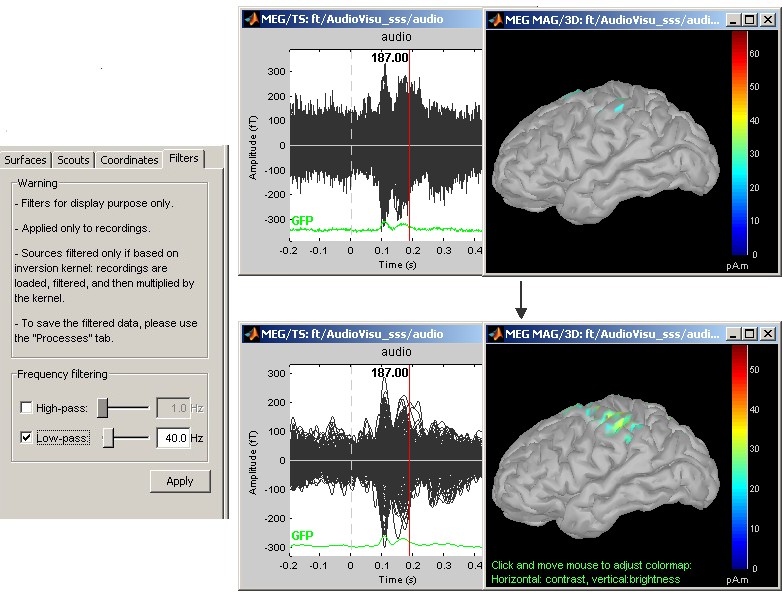
Online bandpass filtering
Recordings and sources: 40Hz low-pass filtering with the "Filters" tab in main Brainstorm window.
Defining cortical region of interest: Scout
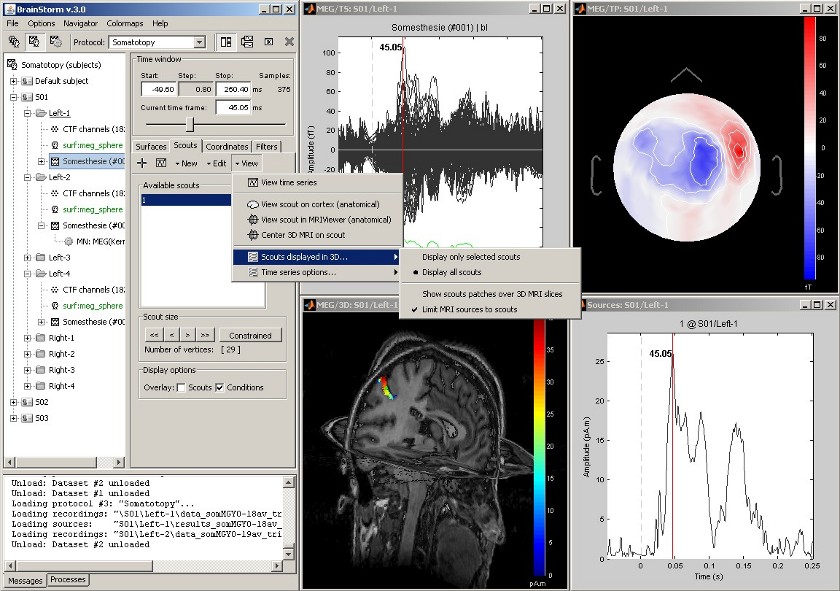
Acquisition system: CTF MEG - 151 sensors
Scouts are cortical regions of interest, defined graphically from the "Scouts" tab. They can be used to extract the time series of MEG and EEG generators within a single or mulitlple brain region.
The following example shows the cortical response to an electric stimulation of the left index finger. With the two scouts Left and Right, one can observe the electrical activity in the primary somatosensory cortex from each hemisphere.
From surface to volume: MRI integration
Acquisition system: CTF MEG - 151 sensors
Same experiment as above, with additional 3D display of the scout activity in MRI slices.
Time-frequency decompositions
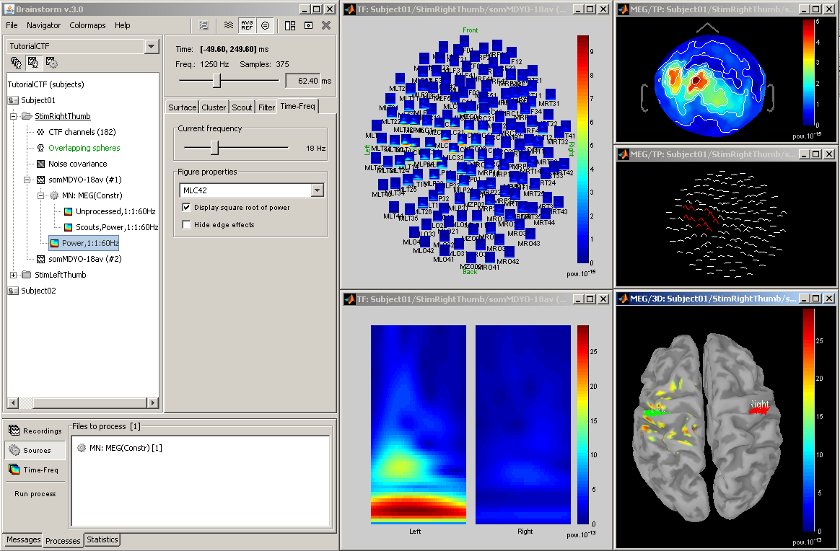
Acquisition system: CTF MEG - 151 sensors
Time-frequency decompositions of sensor data and source time series, extracted from cortical regions of interest.
Statistical inference: t-test maps
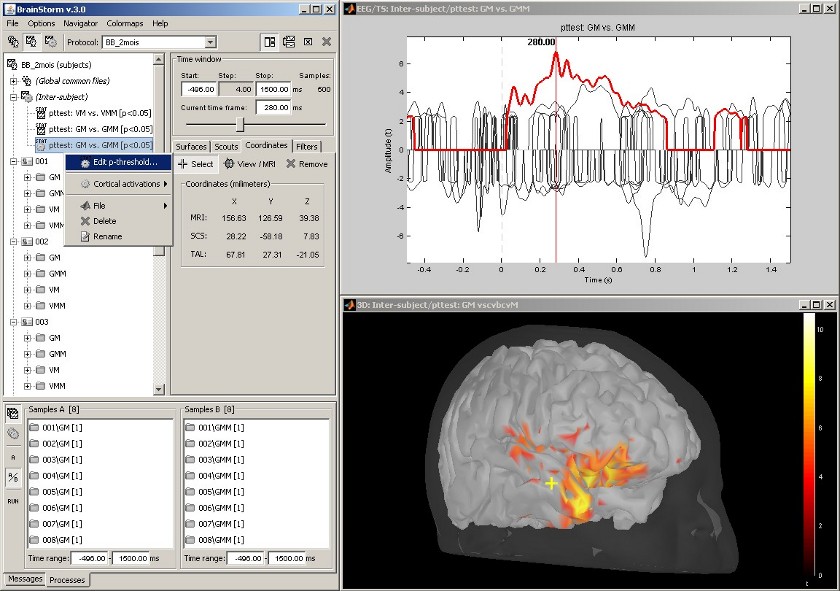
Acquisition system: EGI GSN - Baby 64 electrodes
The "Processes" tab can also be used for running statistical tests e.g., to evaluate contrasts between two experimental conditions.
The following example features the evaluation of the difference between conditions GM and GMM, from the source maps of mulitple subjects (paired Student t-test, p<0.05). The top figure shows the significance of the difference at the sensor level across time. The bottom figure displays the thresholded t-values at the cortical level at 280ms.
This image also illustrates the "Coordinates" tab: It is possible to pick any point from any surface by clicking on it, and immediately get its coordinates in all the coordinates systems used by Brainstorm (MRI, Subject's head and Talairach).
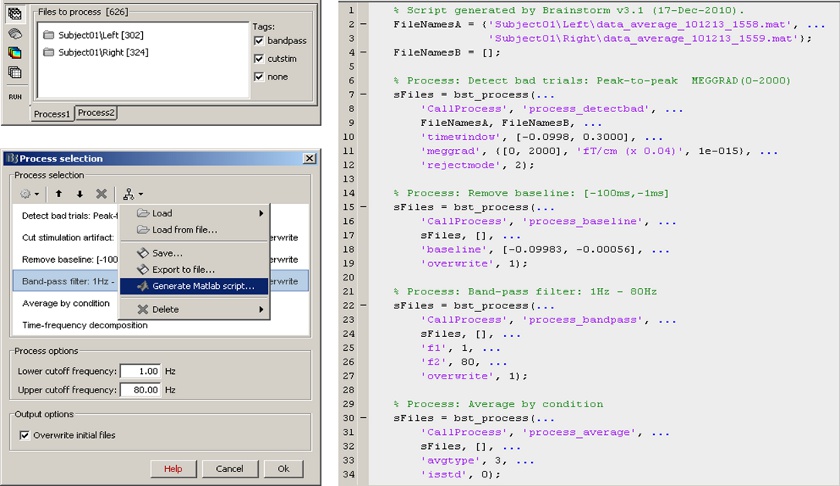
Scripting environment
Everything that can be done in the interface with mouse clicks can be converted automatically to Matlab scripts, using the Process1 and Process2 tabs.

