Hello,
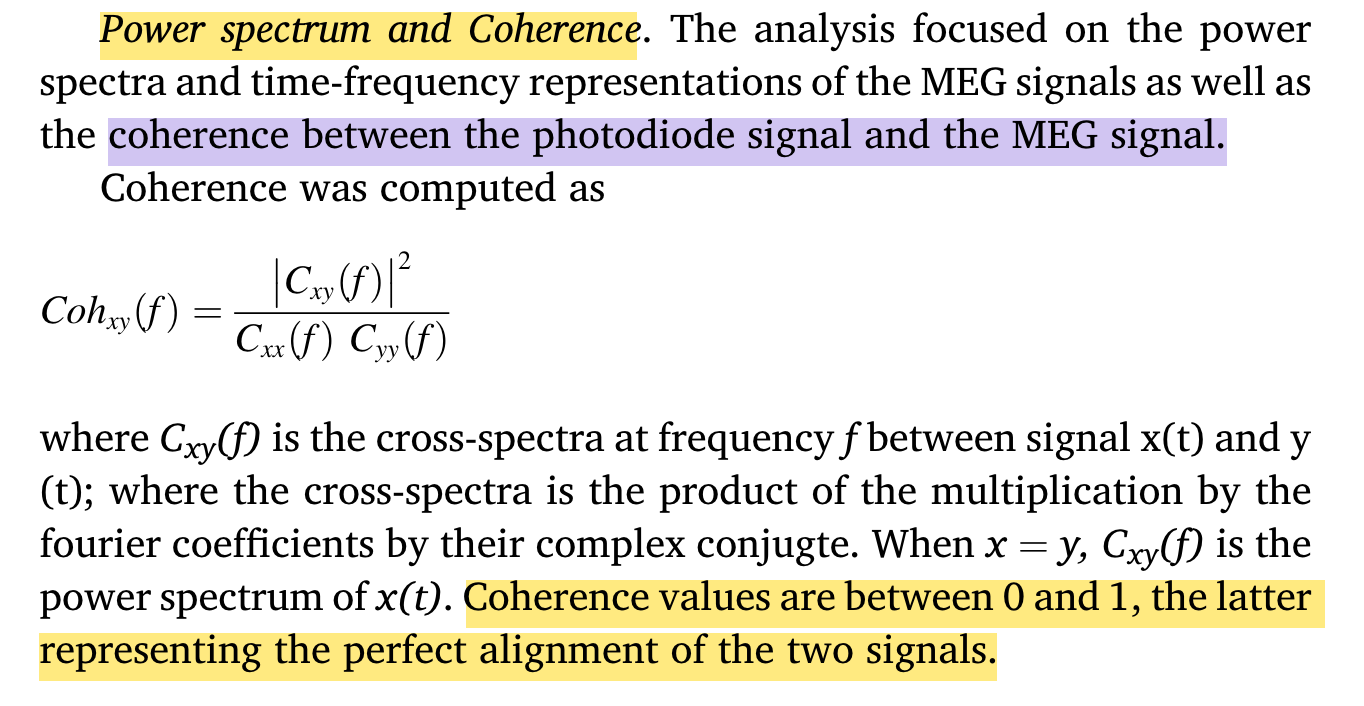
I'm wondering whether the measure of TF map (especially the "coefficient") in Brainstorm has some relationship with a "coherence definition" that I found in a reference paper (the following screenshot).
Since my research has something to do with frequency information, I need to make clear how do you measure TF map in Brainstorm. Any reference paper of your works would help a lot !
In Brainstorm, for a time series x(t), its TF map is a complex representations, let's call it X(t,f), this TF representation can be aggregated over the time axis, to obtain a complex spectral representation X(f).
The coefficient of a complex TF map, X(t,f), (or of a complex spectrum X(f)) is the magnitude of it abs(X).
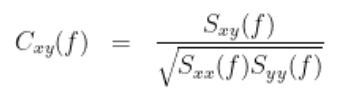
Now, with respect to coherence, as you can see in the connectivity tutorial, the complex coherence between signals x and y, this is to say C_xy(f) is computed from the cross-spectra S_xy(f) between those signals, and their respective power spectrum S_xx(f) and Syy(f). Finally, S_xx(f) is equal to the square of the coefficient (magnitude) of the complex spectra of X:
S_xx(f) = |X(f)|^2
A post would be very short to go through all the details on these topics, you can check these reference (one is a shameless own work) for further information.
-
Nolte G, Bai O, Wheaton L, Mari Z, Vorbach S, Hallett M.
Identifying true brain interaction from EEG data using the imaginary part of coherency.
Clinical Neurophysiology. 2004 Oct;115(10):2292–307.
-
Cassani, R. & Falk, T. H. (2018)
Spectrotemporal Modeling of Biomedical Signals: Theoretical Foundation and Applications. in Reference Module in Biomedical Sciences (Elsevier, 2018).
-
Vinck M, Oostenveld R, van Wingerden M, Battaglia F, Pennartz CM
An improved index of phase-synchronization for electrophysiological data in the presence of volume-conduction, noise and sample-size bias
Neuroimage, Apr 2011