Dear Brainstorm experts:
I have a problem with the average source report; the scout time series result looks strange, with lots of zigzag patterns.
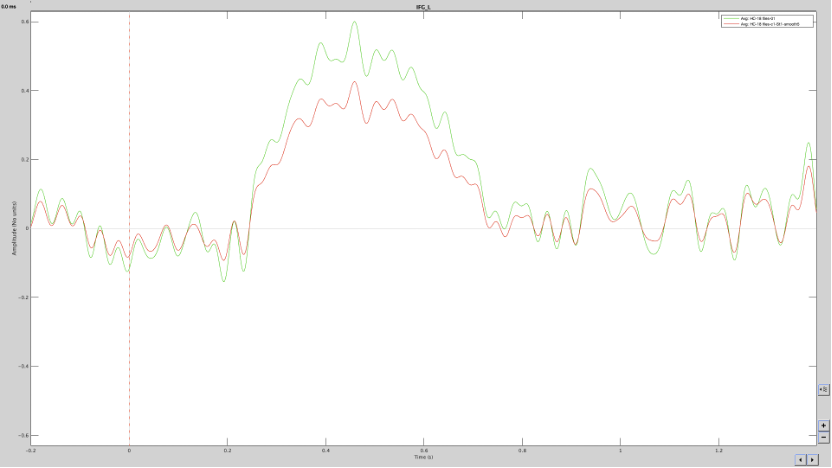
Green-line: average source data only with z-score ; Red-line: average source data with z-score & smooth(5mm)
I'm not understanding it is correct or not.
I wonder that whether I made some mistake in my analysis process or not.
In preprocessing,
I have done my data with a notch filter, deleted bad channels, bandpass filter (<30Hz), removed baseline: [-200, -1], removed linear trend, and removed bad trials.
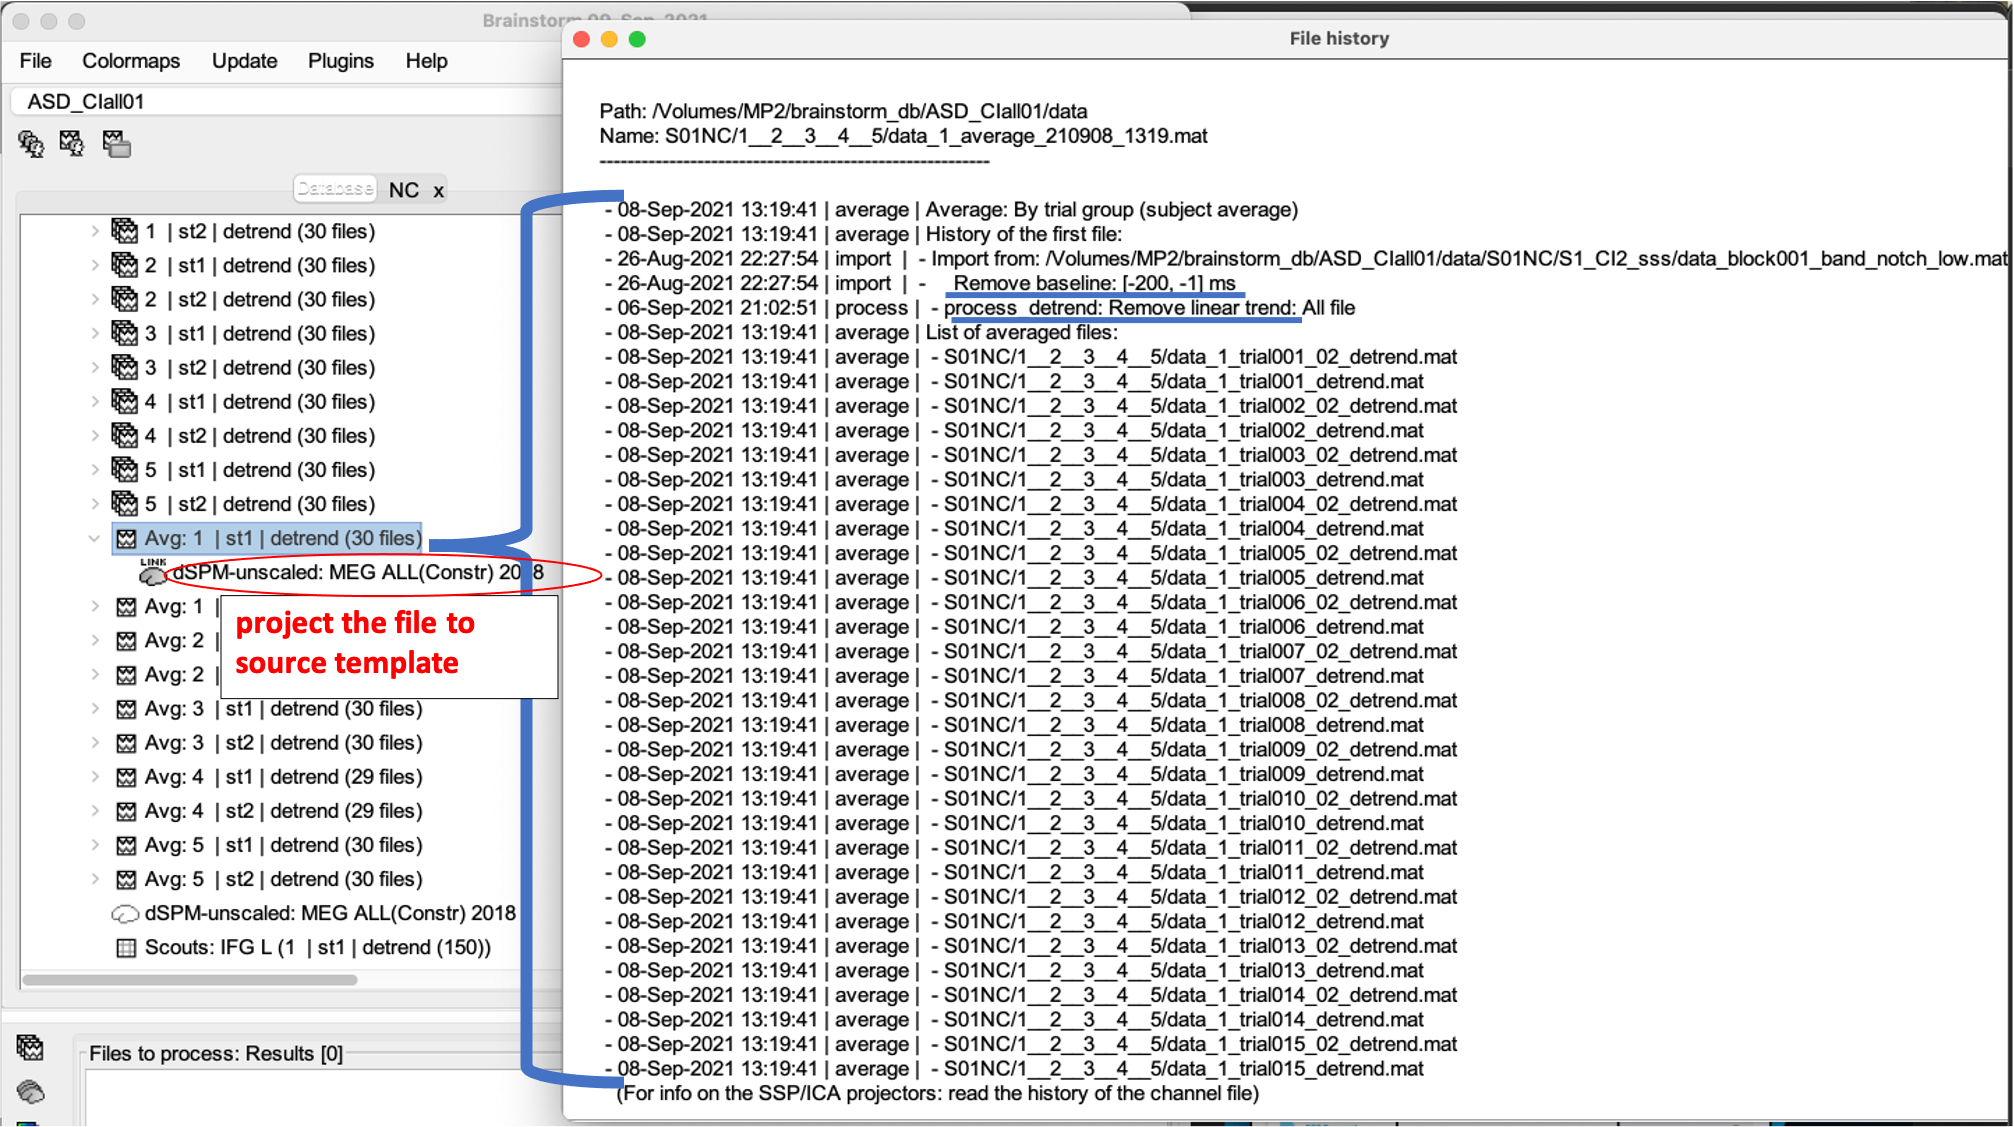
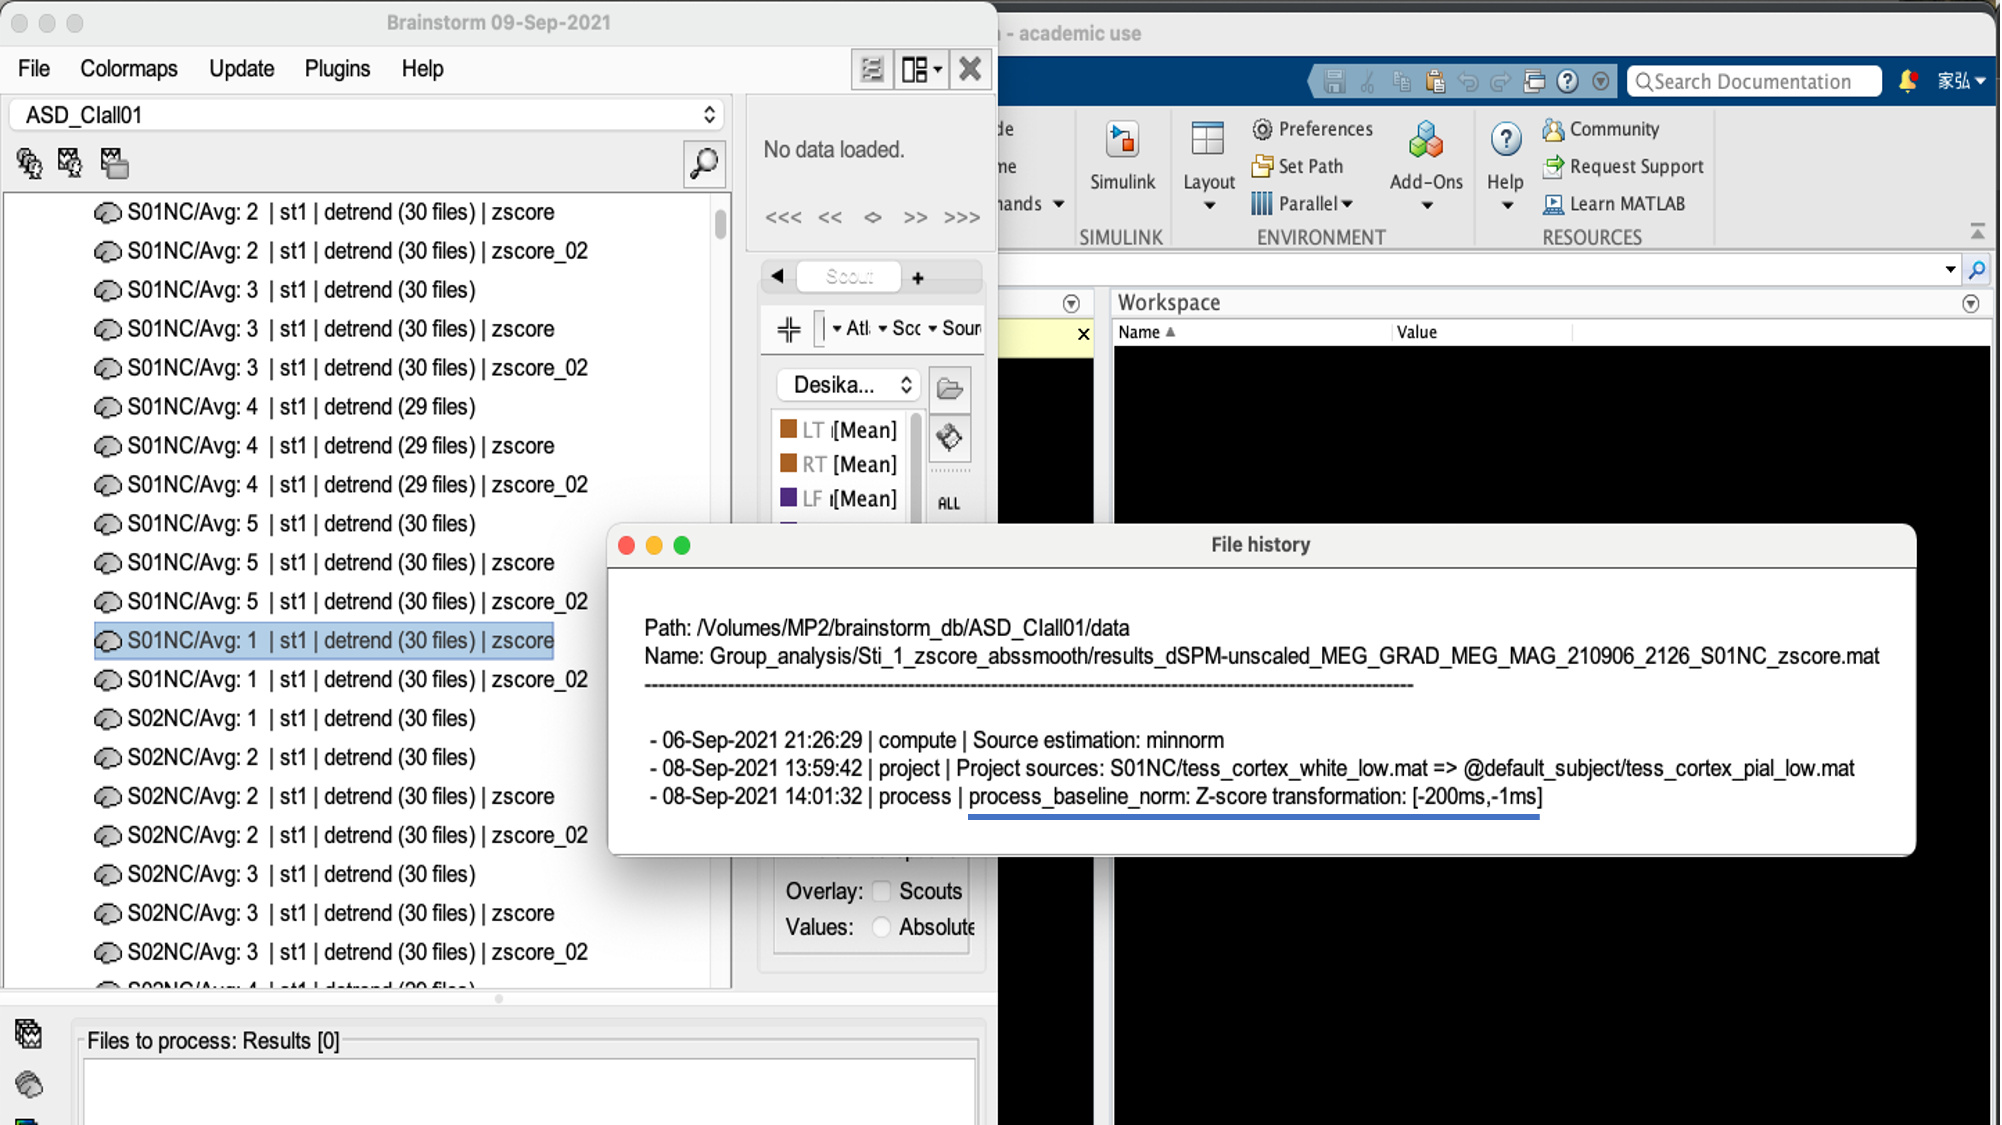
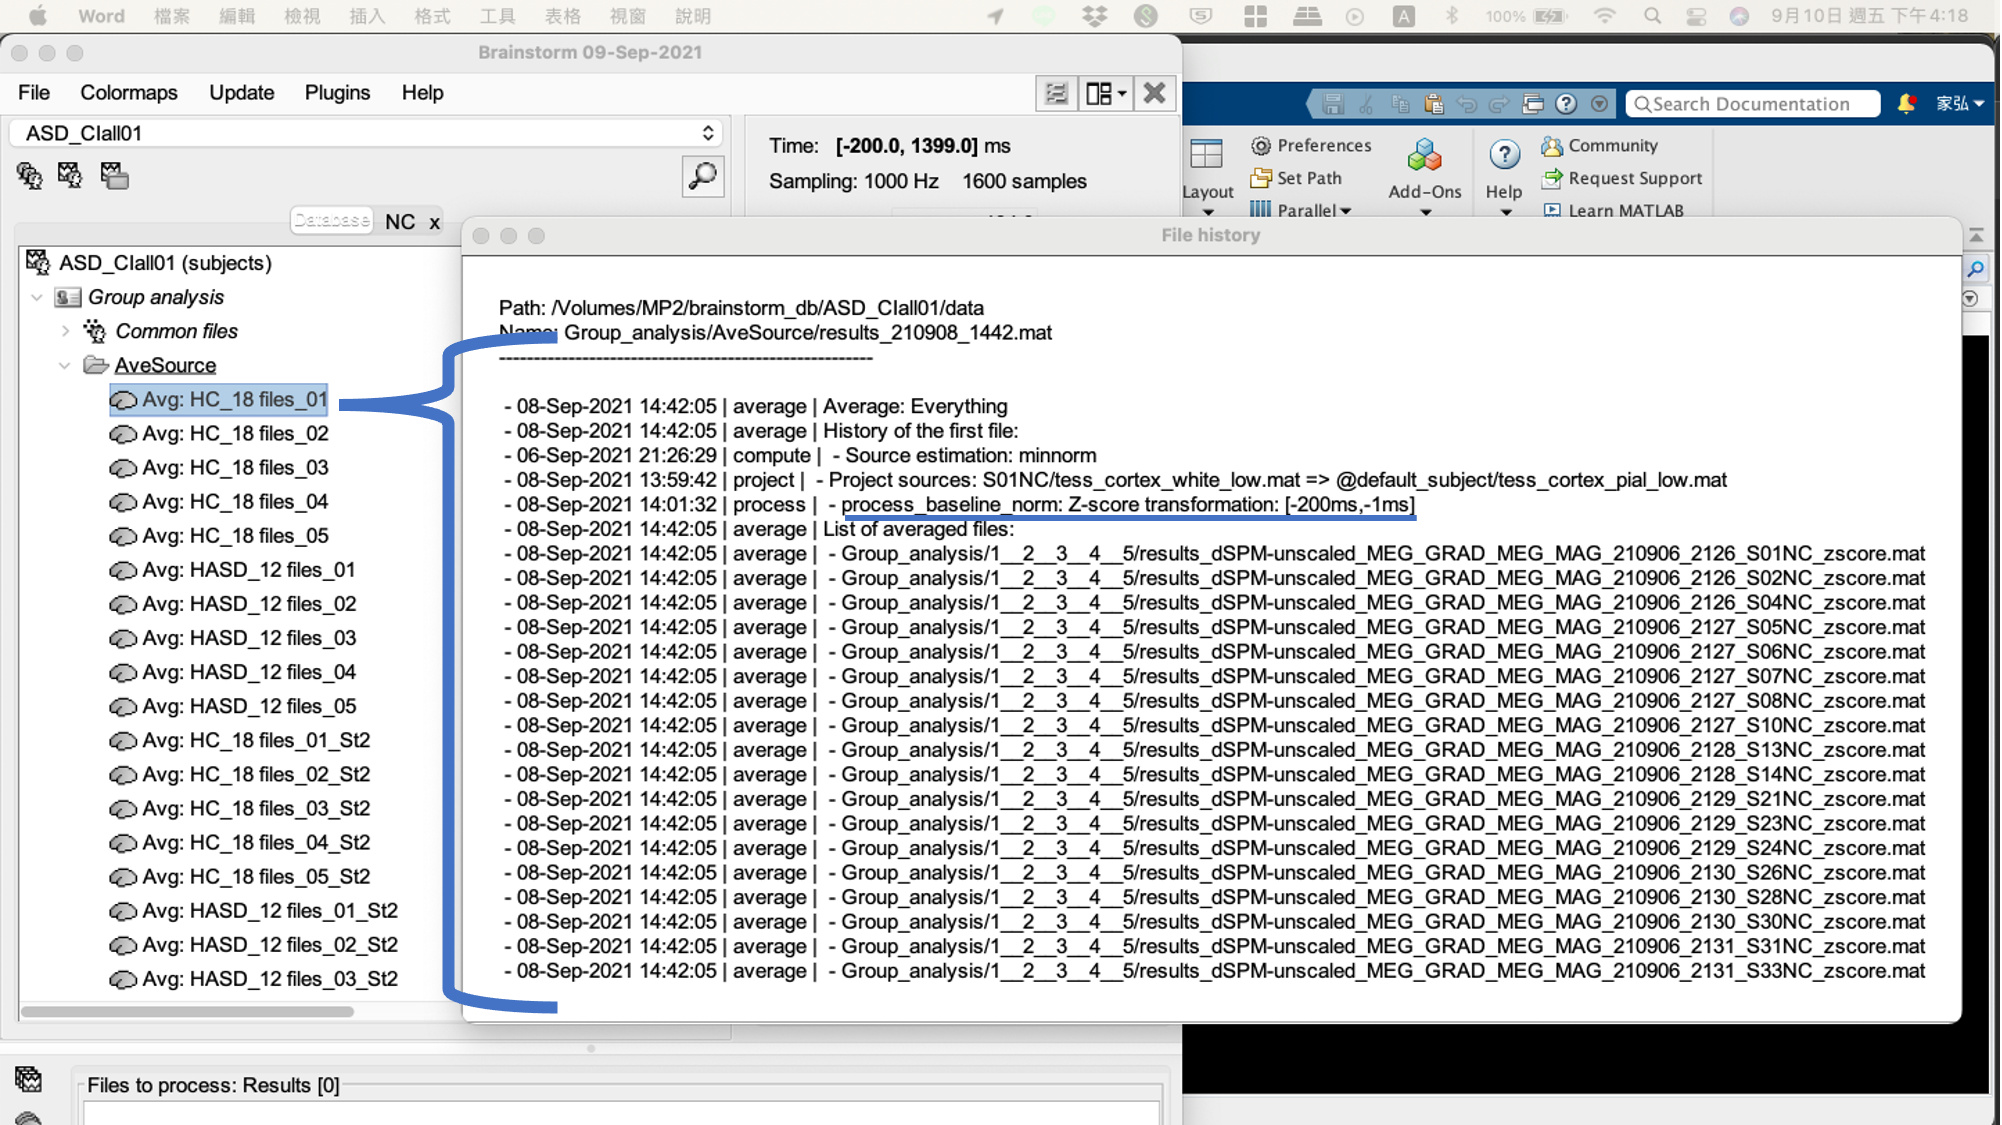
Then, I project the average condition of each subject’s source data to the template for group analysis.
In each group-level source data, I have done z-score transformation[-200, -1] and average the same condition through the same group.
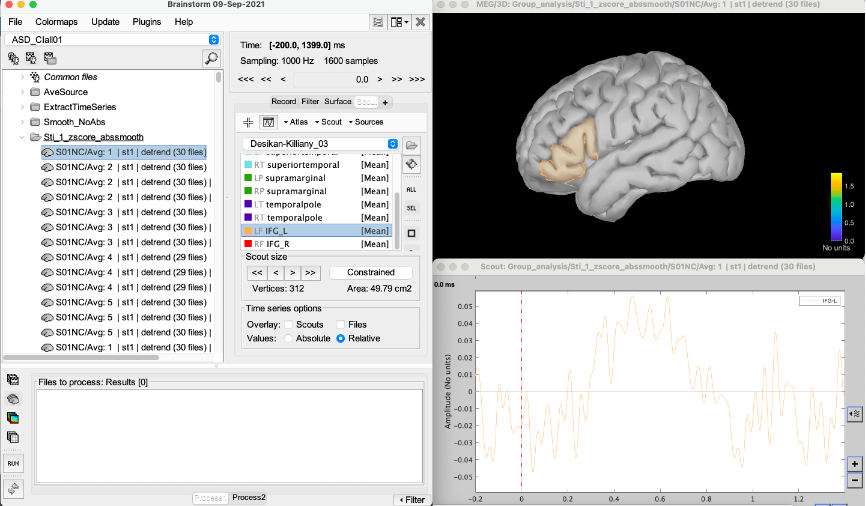
The following picture is one of the subjects in the HC group, scout time series: IFG_L.
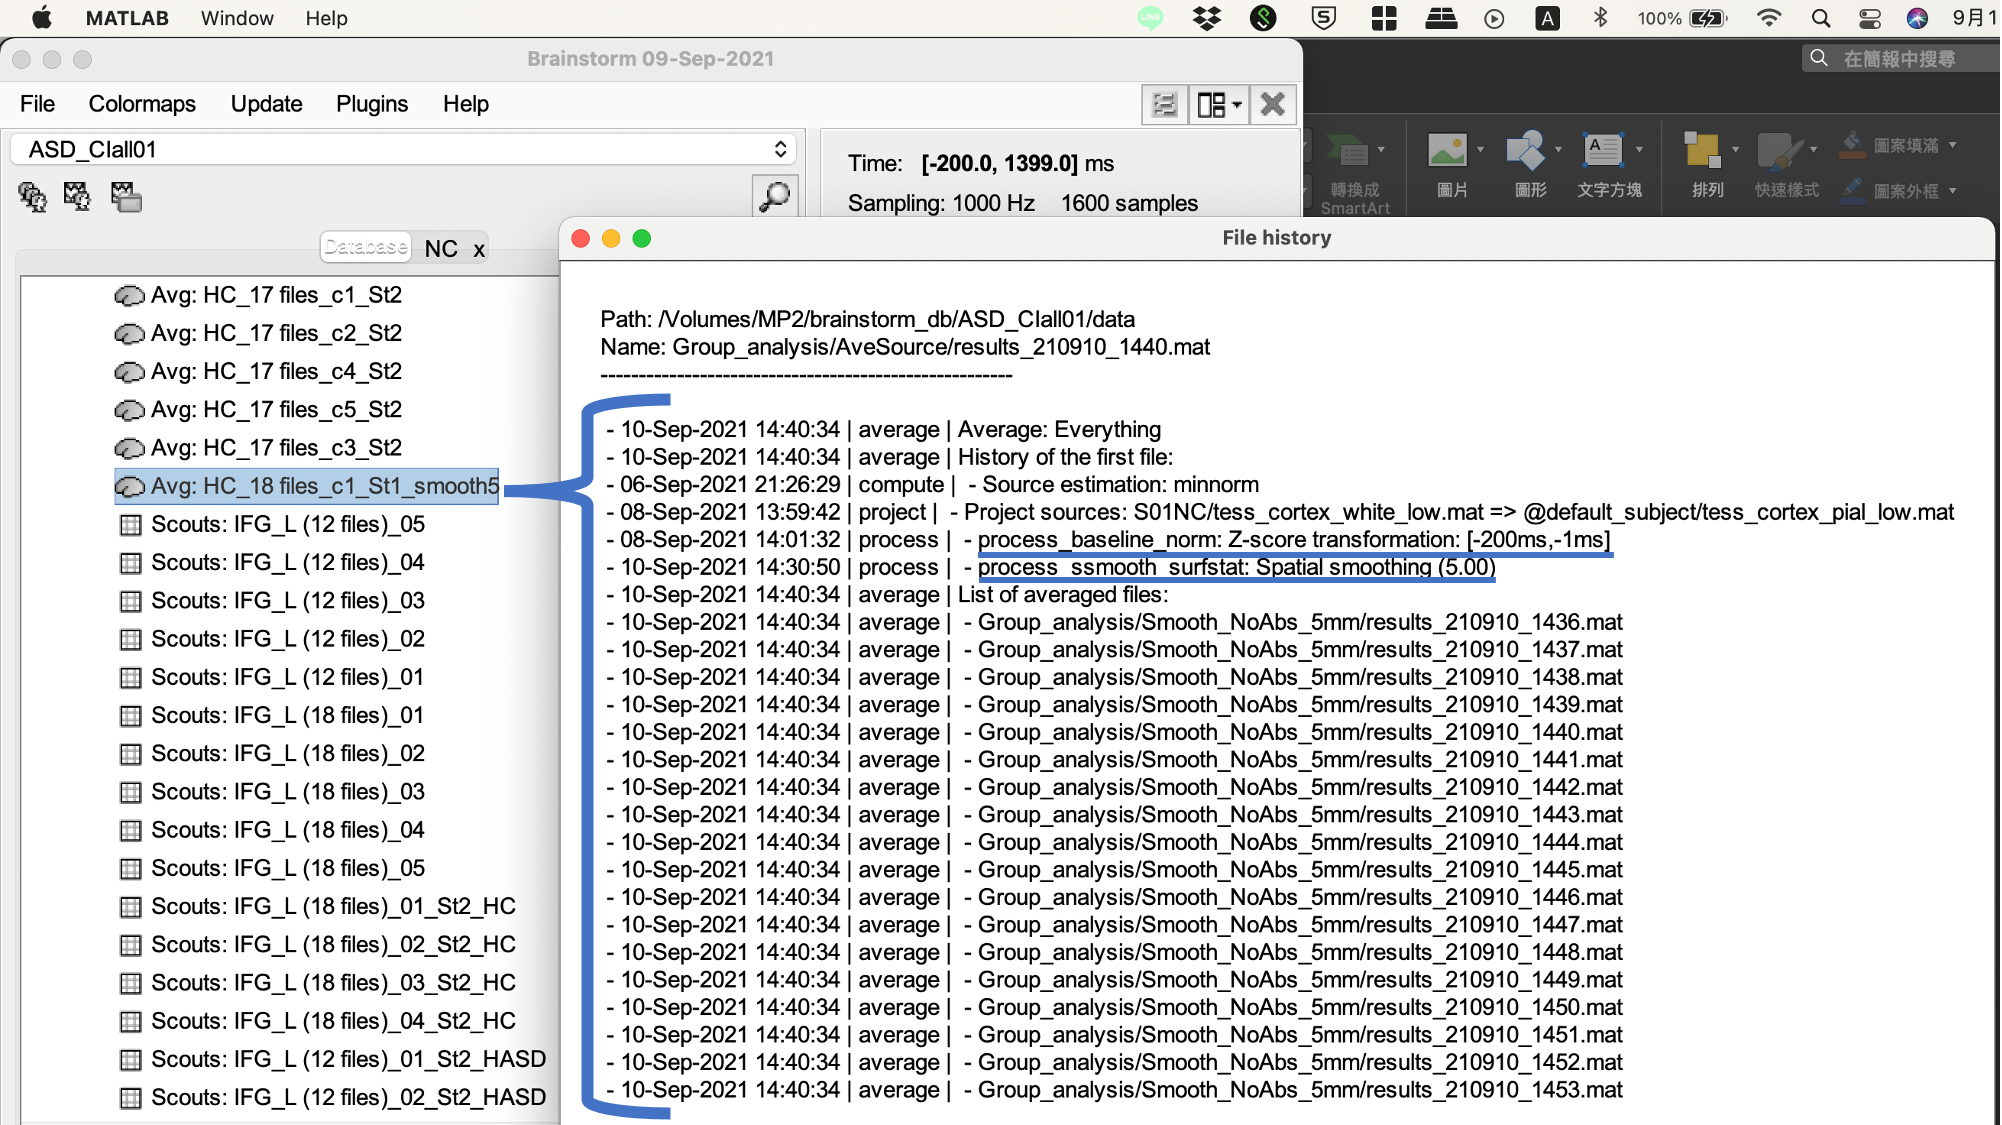
After an average of the 18 subjects in the HC group,
I have done ssmooth(5mm) and only z-score data.
I plot the scout time series reports separately with ssmooth(5mm) and only z-score data.
However, the scout time series result looks strange, with many zigzag patterns, as in picture#1.
I need your help and suggestion for further analysis.
Thank you very much.
Best regard
the scout time series result looks strange, with lots of zigzag patterns.
I think it looks good, if you expect to see this effect between 200ms and 700ms.
These "zigzags" are signal oscillations that are normal for MEG or EEG recordings. Open your MEG signals, you'll see the same. If you don't like them, low-pass filter your signals with an even lower threshold than 30Hz (but I wouldn't recommend that).
If you are not familiar with this kind of oscillating signals, you might be interested in reading some basic background literature in electrophysiology, followed by the references listed on the Tutorials page, before moving forward with MEG source modeling:
https://neuroimage.usc.edu/brainstorm/Tutorials#Background_readings
removed baseline: [-200, -1], removed linear trend
Use one or the other, not both.
We tend to recommend the former.
I have done z-score transformation[-200, -1]
Looks like you used dSPM. Computing this Z-score with respect to a baseline cancels the previous dSPM normalization. It's either/or.
https://neuroimage.usc.edu/brainstorm/Tutorials/SourceEstimation#Source_map_normalization
average the same condition through the same group.
From there, it gets difficult to follow what you did from your description, but it doesn't look bad.
In case of doubts, refer to the recommendations in these tutorials: