Hello guys,
I’m stimulating a group of subjects with a 10 Hz tACS (transcranial alternating stimulation) at C3 position vs sham stimulation for 15 minutes to see if the motor consolidation can be positively influenced in this way. I’m also recording 5 minutes EEG (C3, Cz and C4) before and 15 minutes EEG after the stimulation, to see if the alpha power or the IAF changes when the subjects receive the real stimulation. I’m wondering if I can use Brainstorm to calculate these 2 parameters.
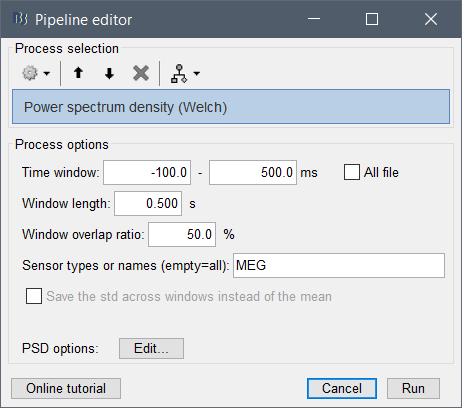
What I managed to do until now is: load the EDF data in Brainstorm - split them in 1 second epochs - remove DC offset - eliminate the epochs with artifacts - select 60 epochs of 1 second and run a frequency analysis with the Welch Method (saving the average of the values) with a window length of 1 second and an overlap of 50 % - then visually compare the Y coordinate of the IAF of the subject that received real stim vs the Y coordinate of the IAF of the subject that received the sham stim.
But I’m not sure how to calculate the alpha power / extract this parameter from the graph of the power spectrum. And I also don’t know if the window length for the frequency analysis should be 1 second and the overlap 50%.
I’ve just started working with EEG data so I would really appreciate your advice here!
All the best,
Alexandru Barbu
Klinik für Neurologie
Uniklinikum Leipzig
Hello,
What you did seems reasonable.
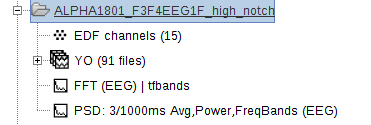
You can do something simpler, you don’t need to explicitly import the epochs of 1s. Instead, you can mark the bad segments in the continuous EDF file, then run the PSD process on the continuous file. The bad segments will be ignored.
To get one single alpha power value, you can average the frequencies bins around the peak. Either you use a narrow frequency band and adapt the peak value for each subject (varies between subjects), or simply use a broader band that fits all the subjects (eg. 8-12Hz). In the options of the PSD process, you can click on the “Edit” button and compute this average directly. Alternatively, run the process “Frequency > Average in time or frequency bands”.
For the length of the estimator window: if you increase it, you’d get a higher frequency resolution (smaller step between two frequency bins). Not mandatory if you’re interested in a relatively wide frequency band. The overlap of 50% is a good default value.
Note that in the procedure you used, there is no overlap used. It computes the PSD for each input file independently and then average the output values. Your blocks of 1s are processed separately, therefore there is not enough data in each block to have an overlap. The recommended procedure is to process directly the continuous file.
Cheers,
Francois
Thank you Francois for the very helpful answer! After doing this I get this results for the Alpha band:
val(:,:,3) =
1.0e-011 *
0.2021   - for C3 electrode
0.1889   - for Cz electrode
0.2691   - for C4 electrode
According to Brainstorm the measuring unit for Power is signal units[SUP]2[/SUP]/Hz*10[SUP]-8[/SUP]. But what is the signal unit? Microvolt?
And would you recommend transforming these really small values or to introduce them in this form in the ANOVA?
Many thanks!
Alexandru
[QUOTE=Francois;11025]Hello,
What you did seems reasonable.
You can do something simpler, you don’t need to explicitly import the epochs of 1s. Instead, you can mark the bad segments in the continuous EDF file, then run the PSD process on the continuous file. The bad segments will be ignored.
To get one single alpha power value, you can average the frequencies bins around the peak. Either you use a narrow frequency band and adapt the peak value for each subject (varies between subjects), or simply use a broader band that fits all the subjects (eg. 8-12Hz). In the options of the PSD process, you can click on the “Edit” button and compute this average directly. Alternatively, run the process “Frequency > Average in time or frequency bands”.
For the length of the estimator window: if you increase it, you’d get a higher frequency resolution (smaller step between two frequency bins). Not mandatory if you’re interested in a relatively wide frequency band. The overlap of 50% is a good default value.
Note that in the procedure you used, there is no overlap used. It computes the PSD for each input file independently and then average the output values. Your blocks of 1s are processed separately, therefore there is not enough data in each block to have an overlap. The recommended procedure is to process directly the continuous file.
Cheers,
Francois[/QUOTE]
Brainstorm uses the international system of units for storing all the values, without any scaling.
Therefore the EEG values are saved in Volts (microVolt range => ~1e-6V), and the power in each frequency bin is in Volt^2/Hz (~1e-12 V^2/Hz).
I don’t think you need to scale the values before computing any statistics. ANOVAs and t-test compute unitless ratios.
Francois
Thank you again Francois!!
All the best,
Alexandru
[QUOTE=Francois;11028]Brainstorm uses the international system of units for storing all the values, without any scaling.
Therefore the EEG values are saved in Volts (microVolt range => ~1e-6V), and the power in each frequency bin is in Volt^2/Hz (~1e-12 V^2/Hz).
I don’t think you need to scale the values before computing any statistics. ANOVAs and t-test compute unitless ratios.
Francois[/QUOTE]
After I mark the artifacts in the raw file, I want to analyse the first 100 seconds without artifacts from EEG datasets with the Welch method (1 second window, 50 % overlap). Is there any way to know how many seconds to chose from the raw file when running the Welch analysis in order to obtain an analysis of [U]only the first 100 seconds without artifacts[/U]?
After exporting the data to Matlab, the power is calculated at different frequencies: 0.976562500000000 1.95312500000000 2.92968750000000 3.90625000000000 4.88281250000000 5.85937500000000 6.83593750000000 7.81250000000000 8.78906250000000 9.76562500000000 10.7421875000000 11.7187500000000 etc How could I calculate the power at exactly 1 Hz, 2 Hz, 3 Hz and so on?
Thanks!!
Alexandru
Hi Alexandru,
Is there any way to know how many seconds to chose from the raw file when running the Welch analysis in order to obtain an analysis of only the first 100 seconds without artifacts?
No, I'm sorry, you have to count this manually.
After exporting the data to Matlab, the power is calculated at different frequencies: 0.976562500000000 1.95312500000000 2.92968750000000 3.90625000000000 4.88281250000000 5.85937500000000 6.83593750000000 7.81250000000000 8.78906250000000 9.76562500000000 10.7421875000000 11.7187500000000 etc How could I calculate the power at exactly 1 Hz, 2 Hz, 3 Hz and so on?
You can't get a user-defined binning with this method, it uses the default of Matlab's FFT method (you can read about this on the Mathworks forum).
One possible option: use longer estimator windows to have a higher frequency resolution, then average the bins in your frequency bands of interest (eg. 2-4Hz, 9-12Hz...)
Or you can simply interpolate the values with interp1, but this is more difficult to justify mathematically I guess.
Francois
Ok thank you for your answer Francois! All the best, Alexandru
[QUOTE=Francois;11099]Hi Alexandru,
No, I’m sorry, you have to count this manually.
You can’t get a user-defined binning with this method, it uses the default of Matlab’s FFT method (you can read about this on the Mathworks forum).
One possible option: use longer estimator windows to have a higher frequency resolution, then average the bins in your frequency bands of interest (eg. 2-4Hz, 9-12Hz…)
Or you can simply interpolate the values with interp1, but this is more difficult to justify mathematically I guess.
Francois[/QUOTE]
Hello everyone, is there a way to export to matlab the file you get after doing the spectral analysis by writing a command in matlab? (which could be integrated in a script). To avoid always right-clicking on the file and then “export to matlab”. All the best, Alexandru
If you are running your analysis from a script, you can simply load it with one of the in_bst_* functions.
For instance:
sFiles = bst_process('CallProcess', 'process_psd', sFiles, [], ...
PsdMat = in_bst_timefreq(sFiles(1).FileName);
If you have more questions, please start one new thread for each topic, it helps with the forum accessibility.
Cheers,
Francois
Thank you Francois!
[QUOTE=Francois;11511]If you are running your analysis from a script, you can simply load it with one of the in_bst_* functions.
For instance:
sFiles = bst_process('CallProcess', 'process_psd', sFiles, [], ...
PsdMat = in_bst_timefreq(sFiles(1).FileName);
If you have more questions, please start one new thread for each topic, it helps with the forum accessibility.
Cheers,
Francois[/QUOTE]
Hi François,
I want to perform a power-spectrum density Welch on several 2-sec epochs (sort of an average of them all). Everytime I put the folder containing them all in the process 1 tab, it only performs the analysis on the first 2-sec epoch... What should I do (it doesnt seem to do the samething with ffts)...
Thank you !
Beatrice
Hello
Are you other epochs marked as bad?
If so, you should mark them all as good if you want to use them in your computation.
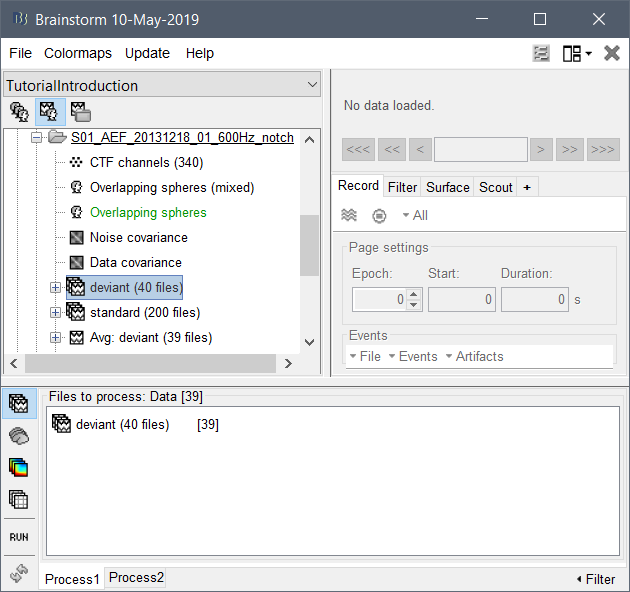
I just tested it on the dataset of the tutorials, and it works well (screen captures below).
If you think there is really a bug somewhere, please post screen captures illustrating your problem.
Thank you for the nice answer !
The epochs that are marked as bad are not wanted in the analysis so i'll keep the marked (if ok)
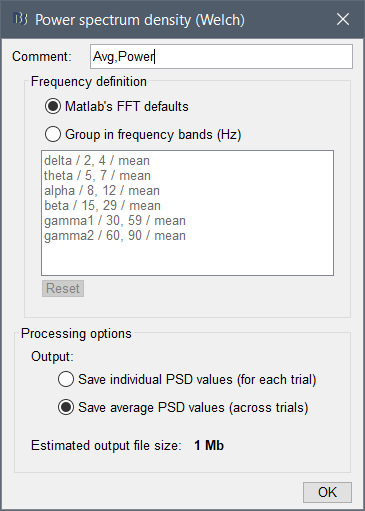
So I tested it choosing PSD values across trials and I think it worked.
I'm wondering if it computes the whole thing (all the trials ) or just the first one as I get these options showing just the first epochs 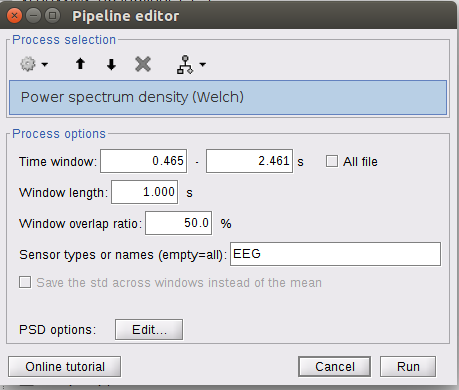
Window lenght should be of how long and overlap ?
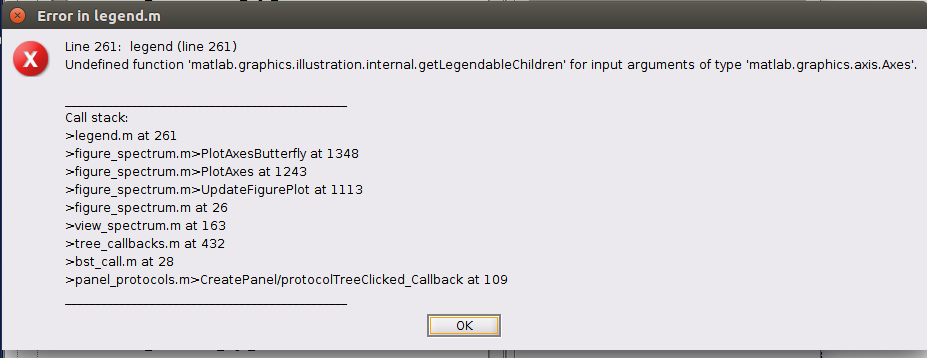
Then when i try to open the power spectrum I get this error
I'm wondering if it computes the whole thing (all the trials ) or just the first one as I get these options showing just the first epochs
If the epochs have different timing or different durations, you should check the box "All file", otherwise it will use the time window of the first file for all the files.
To make sure your output file was computed the way you want, right-click on the file > File > View file history (it should show the list of all the input files) or File > View file contents (nAvg should be the number of files you have input).
Window lenght should be of how long and overlap ?
https://neuroimage.usc.edu/brainstorm/Tutorials/ArtifactsFilter#Evaluation_of_the_noise_level
Then when i try to open the power spectrum I get this error
Which version of Matlab are you using?
Can you upload one of the PSD files you cannot display somewhere, and post the link here?
So i did check the all file for the time window and checked the file history, it worked ! thank you !
For the window length, as the files are epochs of 2 sec, i just choose again 2 sec for the window? for the overlap the files are separated, does it change something ?
I'm using matlab R2018b. Here's an example of the file that produces an error when trying to open it
psd_190516_1025.csv (1.1 KB)
For the window length, as the files are epochs of 2 sec, i just choose again 2 sec for the window?
This is probably a reasonable choice, but only if the frequency resolution you obtain matches what you need. Increasing this value is not possible. Decreasing to 1s for instance would divide by two the step between two frequency bins.
for the overlap the files are separated, does it change something ?
With a 50% overlap and windows of 1s, this would give you an average of 3 windows for each epoch.
With windows of 2s, there is no possible overlap.
I'm using matlab R2018b. Here's an example of the file that produces an error when trying to open it
Please send us the actual .mat file (to find it: right-click on it > File > Show in file explorer).
You won't be able to post it directly on the forum: upload it somewhere (dropbox, google drive, one drive...), create a download link and post it here
Alright so i'll keep the lenght at 2 sec. As the overlaps are not possible I set it to 0 % ? Or just leave it as it is ?
Sorry for the inconvenience here is the .mat file for the welch psd_1801F3F4F.mat (13.0 KB)
and here for the FFT as both produce the same error ...fft_1801F3F41801F.mat (13.0 KB)
Tell me if it is okay otherwise i'll put a downloadable link as you suggested
Alright so i'll keep the lenght at 2 sec. As the overlaps are not possible I set it to 0 % ? Or just leave it as it is ?
If you set an estimator window => duration of the epochs: there is only one window estimated per file, the overlap parameter is not used. Leave it to 50% so that you don't forget to change it back later.
The function bst_psd is called once for each epoch, and the results are averaged together because you selected the option "Output: Save average PSD values".
If you want to understand better what is happening: put a breakpoint at the beginning of function bst_psd.m, run the computation and when the debugger stops explore the contents of the variables, and follow the execution step by step.
here is the .mat file for the welch
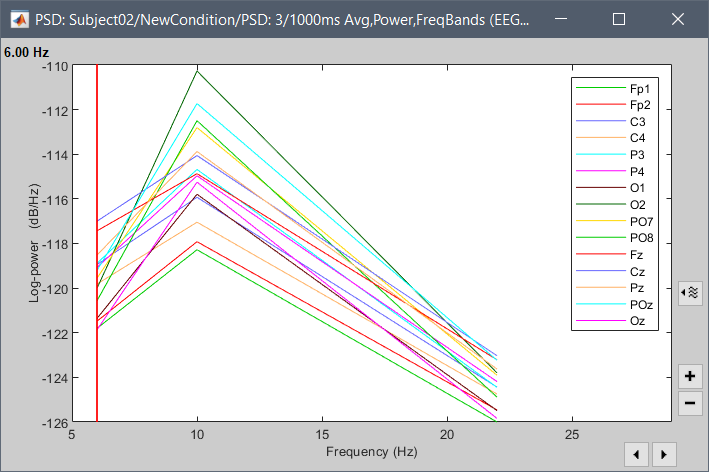
I could download your files and both can be opened in various ways, on various Matlab versions including 2018b, both on Windows 10 and Ubuntu 16. No errors, no warnings.
I suspect there is something wrong with your installation of Matlab. Either reinstall Matlab, install another version, use another computer, or report this bug to the Mathworks customer support.
So I could extract it in the end everything worked fine. I just want to confirm from a technical point of view that what I did is alright. So I selected 2 sec. length windows because my files were already in epochs of 2 sec. Choosing to do a power spectrum analysis with already epoched 2 sec segments is equivalent to doing in it in a continuous file ? What is the main advantage of doing a welch as I did instead of an FFT averaging 2 sec epoch files ?