Hi all,
First, thanks for this amazing program and really clear tutorials that were helpful for a first-time analysis of EEG data.
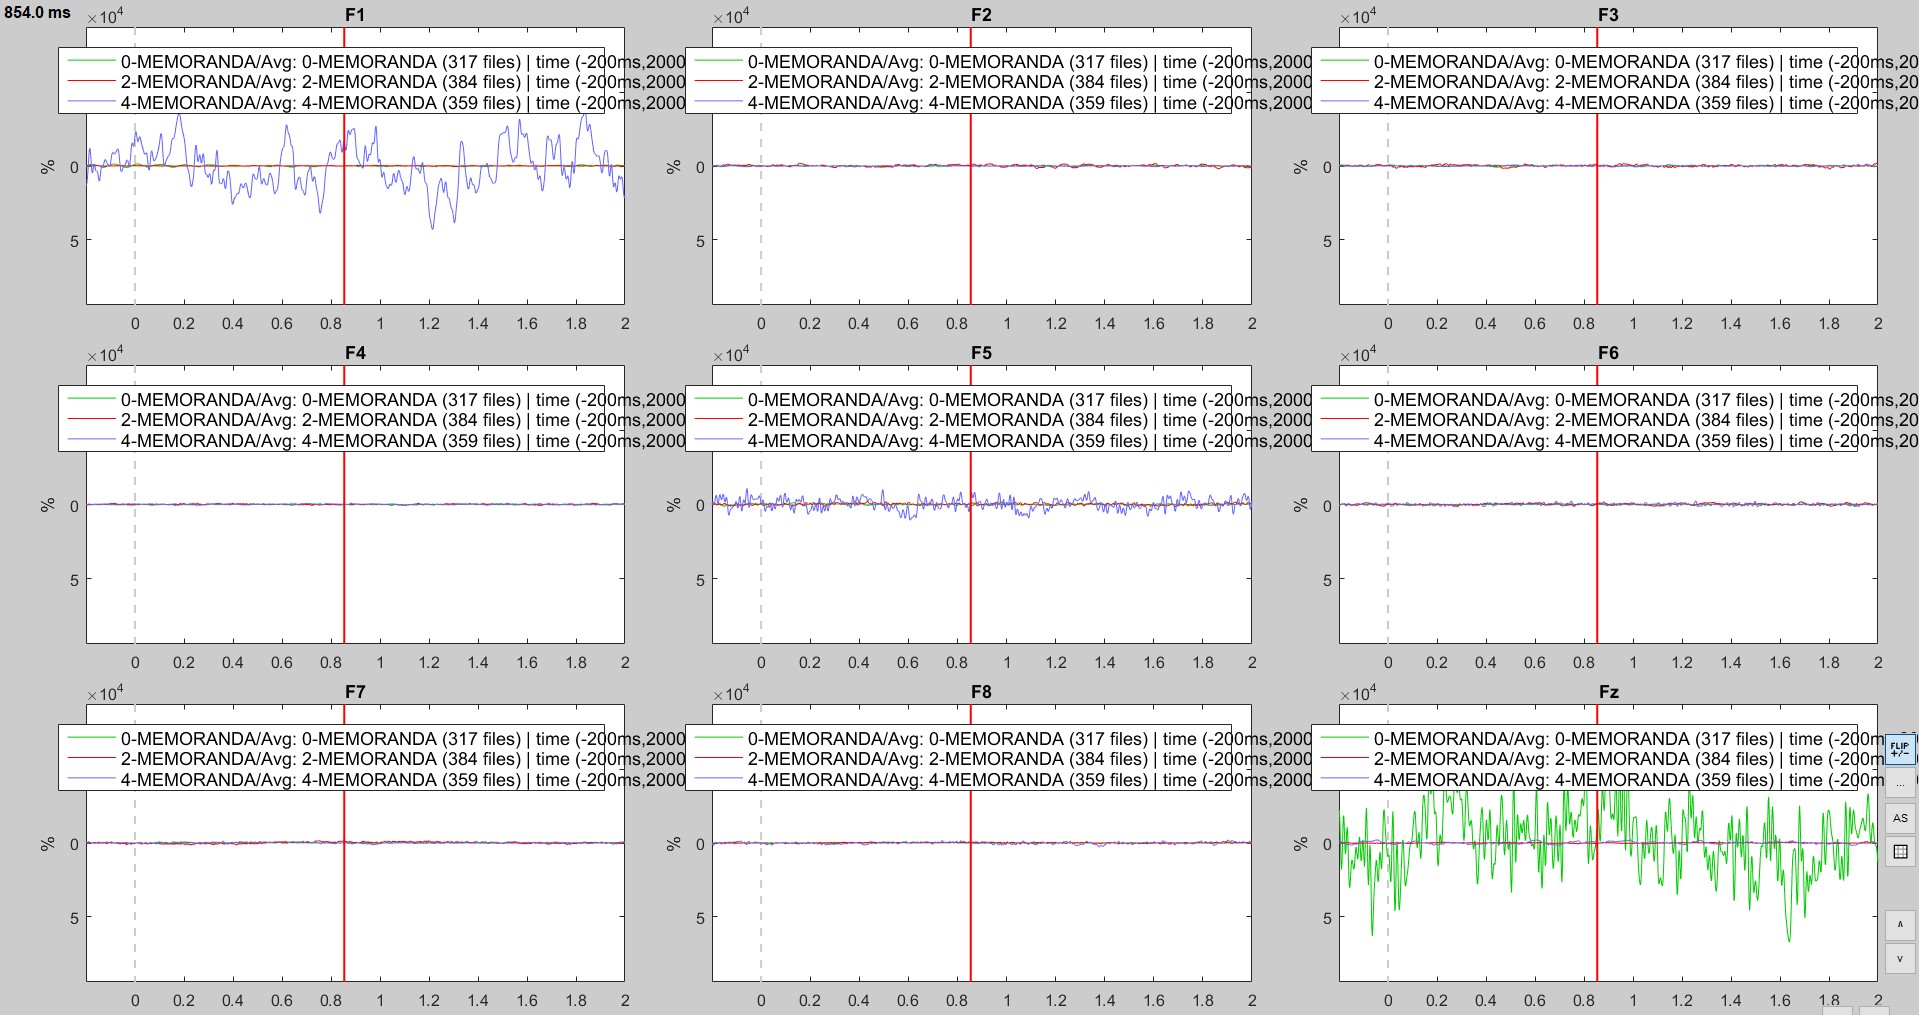
I am trying to run ERP comparison on the data I collected and I encounter a problem at the grand average step that I don’t understand so I was wondering if someone ever encountered the same problem and can provide me some help with it. My issue is that for some electrode in some experimental conditions the signal looks weird (see the purple line in F1 and F5 electrodes and the green one in the Fz electrode on the figure attached, which correspond to grand average for each of the three experimental condition of my experiment).
The experiment was only one run per subject and the three experimental conditions were randomized so I assume that this problem is not due to one particular bad electrode otherwise this weird pattern would have been the same whatever the experimental condition and won’t have been encountered in different electrodes.
Here are the steps of my analysis :
- Filtering data (0.5 – 70Hz + Notch at 50Hz)
- Detecting and rejecting bad electrodes using Power Spectrum Density and manual inspection of data, then interpolating bad electrodes with the default parameters
- Detecting ocular artefact with an ICA and rejecting the components corresponding to blinks and saccades
- Segmentation of trials with DC offset correction using almost the entire of the fixation cross presentation (-1500 ms; -2 ms) as a baseline
- Manual rejection of bad segments
- Baseline normalization using ERD/ERS method with the intervall between -750 and -250 ms of the fixation cross (i.e., baseline) to avoid edge effects
- Weighted average for each subject (because of different amount of trials in each experimental condition)
- Average folders across subject (grand average)
May I have done something wrong ? Do you have any idea of why I have this kind of ERP pattern ?
Thanks a lot for your help!
Lison