Hello,
When calculating TF map (based on source of each trial), I found that the “display on cortex“ mode of TF result at a certain frequency looks similar to the source estimation (after applying band-pass filter to the source) result.
Is there any differences between these two methods?
Thanks!
And another question is,
if I want to know the source or activity at a certain frequency, should I do the “band-pass filter for source” or use the “display on cortex mode of TF map results”?
Looking forward to your reply!
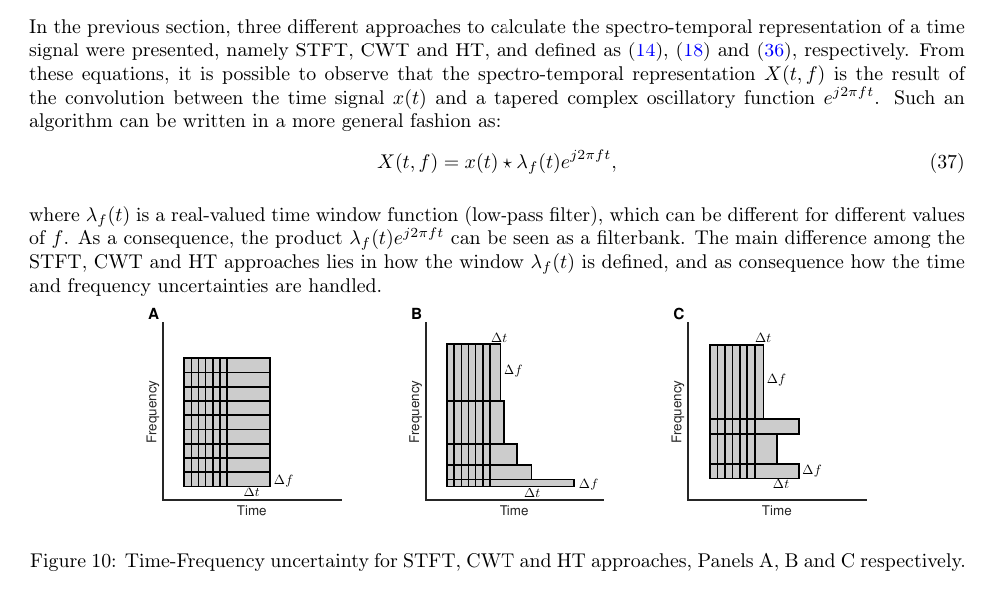
This is true if you are plotting the Magnitude of the TF, results are very similar but they are not the exactly the same. This is due to the fact that frequently used TF methods such as Wavelet transform, Hilbert transform or Short-time Fourier transform can be seen as the result of the convolution of the original signal and a tapered complex oscillatory function, so when magnitude is plotted, this is basically a frequency filter.
(Text and Figure from:
Spectrotemporal Modeling of Biomedical Signals: Theoretical Foundation and Applications Cassani, R. & Falk, T. H., 2018).
As mentioned above, the results are similar, but the differ in how the frequency band is defined.
By band-pass filtering your signal, you are in control of all the parameters of the filter.
For FT, the filter definition changes, in Wavelet transform the frequency filter is defined by the wavelet properties; in STFT, the filter is narrow in frequency and defined by the tapper function and number of samples; lastly in Hilbert transform while you define the limits of the filters, default parameters for their computation are used.
You can check more details in the Additional documentation of the Time-Frequency tutorial:
https://neuroimage.usc.edu/brainstorm/Tutorials/TimeFrequency#Additional_documentation
This mostly depend on your definition of the concepts "activity" and "certain frequency"
Is "activity" power, magnitude?
Is "certain frequency" a frequency band, a specific frequency value?
We applied frequency tagging method to the visual stimuli, and the frequencies are 80hz and 90hz. We want to know the brain activations at 80hz and 90hz.
What would you suggest to use? power or magnitude?
Thanks!
I’ve tried to apply band-pass filter to averaged source of each subject. Since I want to know the frequency at 80 and 90hz, let’s say 80hz, I applied different band-pass filter of 79-81, 79.5-80.5, 79.95-80.05, 79.995-80.005, and the results of the last three looked same. How narrow a band can I apply to the source?
Check with other works in the literature to see which metrics is the most reported.
Keep in mind that TF_power = TF_magniture^2
Another difference is that the TF_magnitude is the instantaneous amplitude and is all the time positive. While filtering the signal is not, but abs(signal_filtered) is very close to TF_magnitude for the same frequency band. If the look the same, it is because the filtered sources are plotted with as absolute values, check the colormap to verify this.
Thanks for the detailed answering! A very important point to make sure:
I’ve tried to apply band-pass filter to averaged source of each subject. Since I want to know the frequency at 80 and 90hz, let’s say 80hz, I applied different band-pass filter of 79-81, 79.5-80.5, 79.95-80.05, 79.995-80.005, and the results of the last three looked same. How narrow a band can I apply to the source?
Thanks!
In practice you need to consider the frequency resolution that can be achieved you with your data, this is 1 / segment_duration, so if you data is 10s, the resolution is 0.1 Hz. So the band in the band-pass filter should be at least as wide as the frequency resolution.
All the filter that you mention are centered around 80Hz, thus their similarities. You can check the filter specifications and use the one that is more convenient for you.