Hi all,
Does anyone know how to change the transparency (i.e., the alpha value of the line plot) of the connectivity edge in the circular plot?
Thanks,
Hisato
Hi all,
Does anyone know how to change the transparency (i.e., the alpha value of the line plot) of the connectivity edge in the circular plot?
Thanks,
Hisato
Transparency of edges (links) is not implemented in connectivity graphs (yet).
Was this plot created with the current connectivity graph option in Brainstorm?
If so, the links are lines objects, and officially they do not have a transparency / alpha property.
However, in more modern versions of Matlab you can set their color as a 4-elment array with the last element being the alpha value.
With the connectivity graph open, retrieve the line handles with:
% Get links
MeasureLinks = getappdata(hFig, 'MeasureLinks');
Hi, Raymundo,
Thank you for getting back to me.
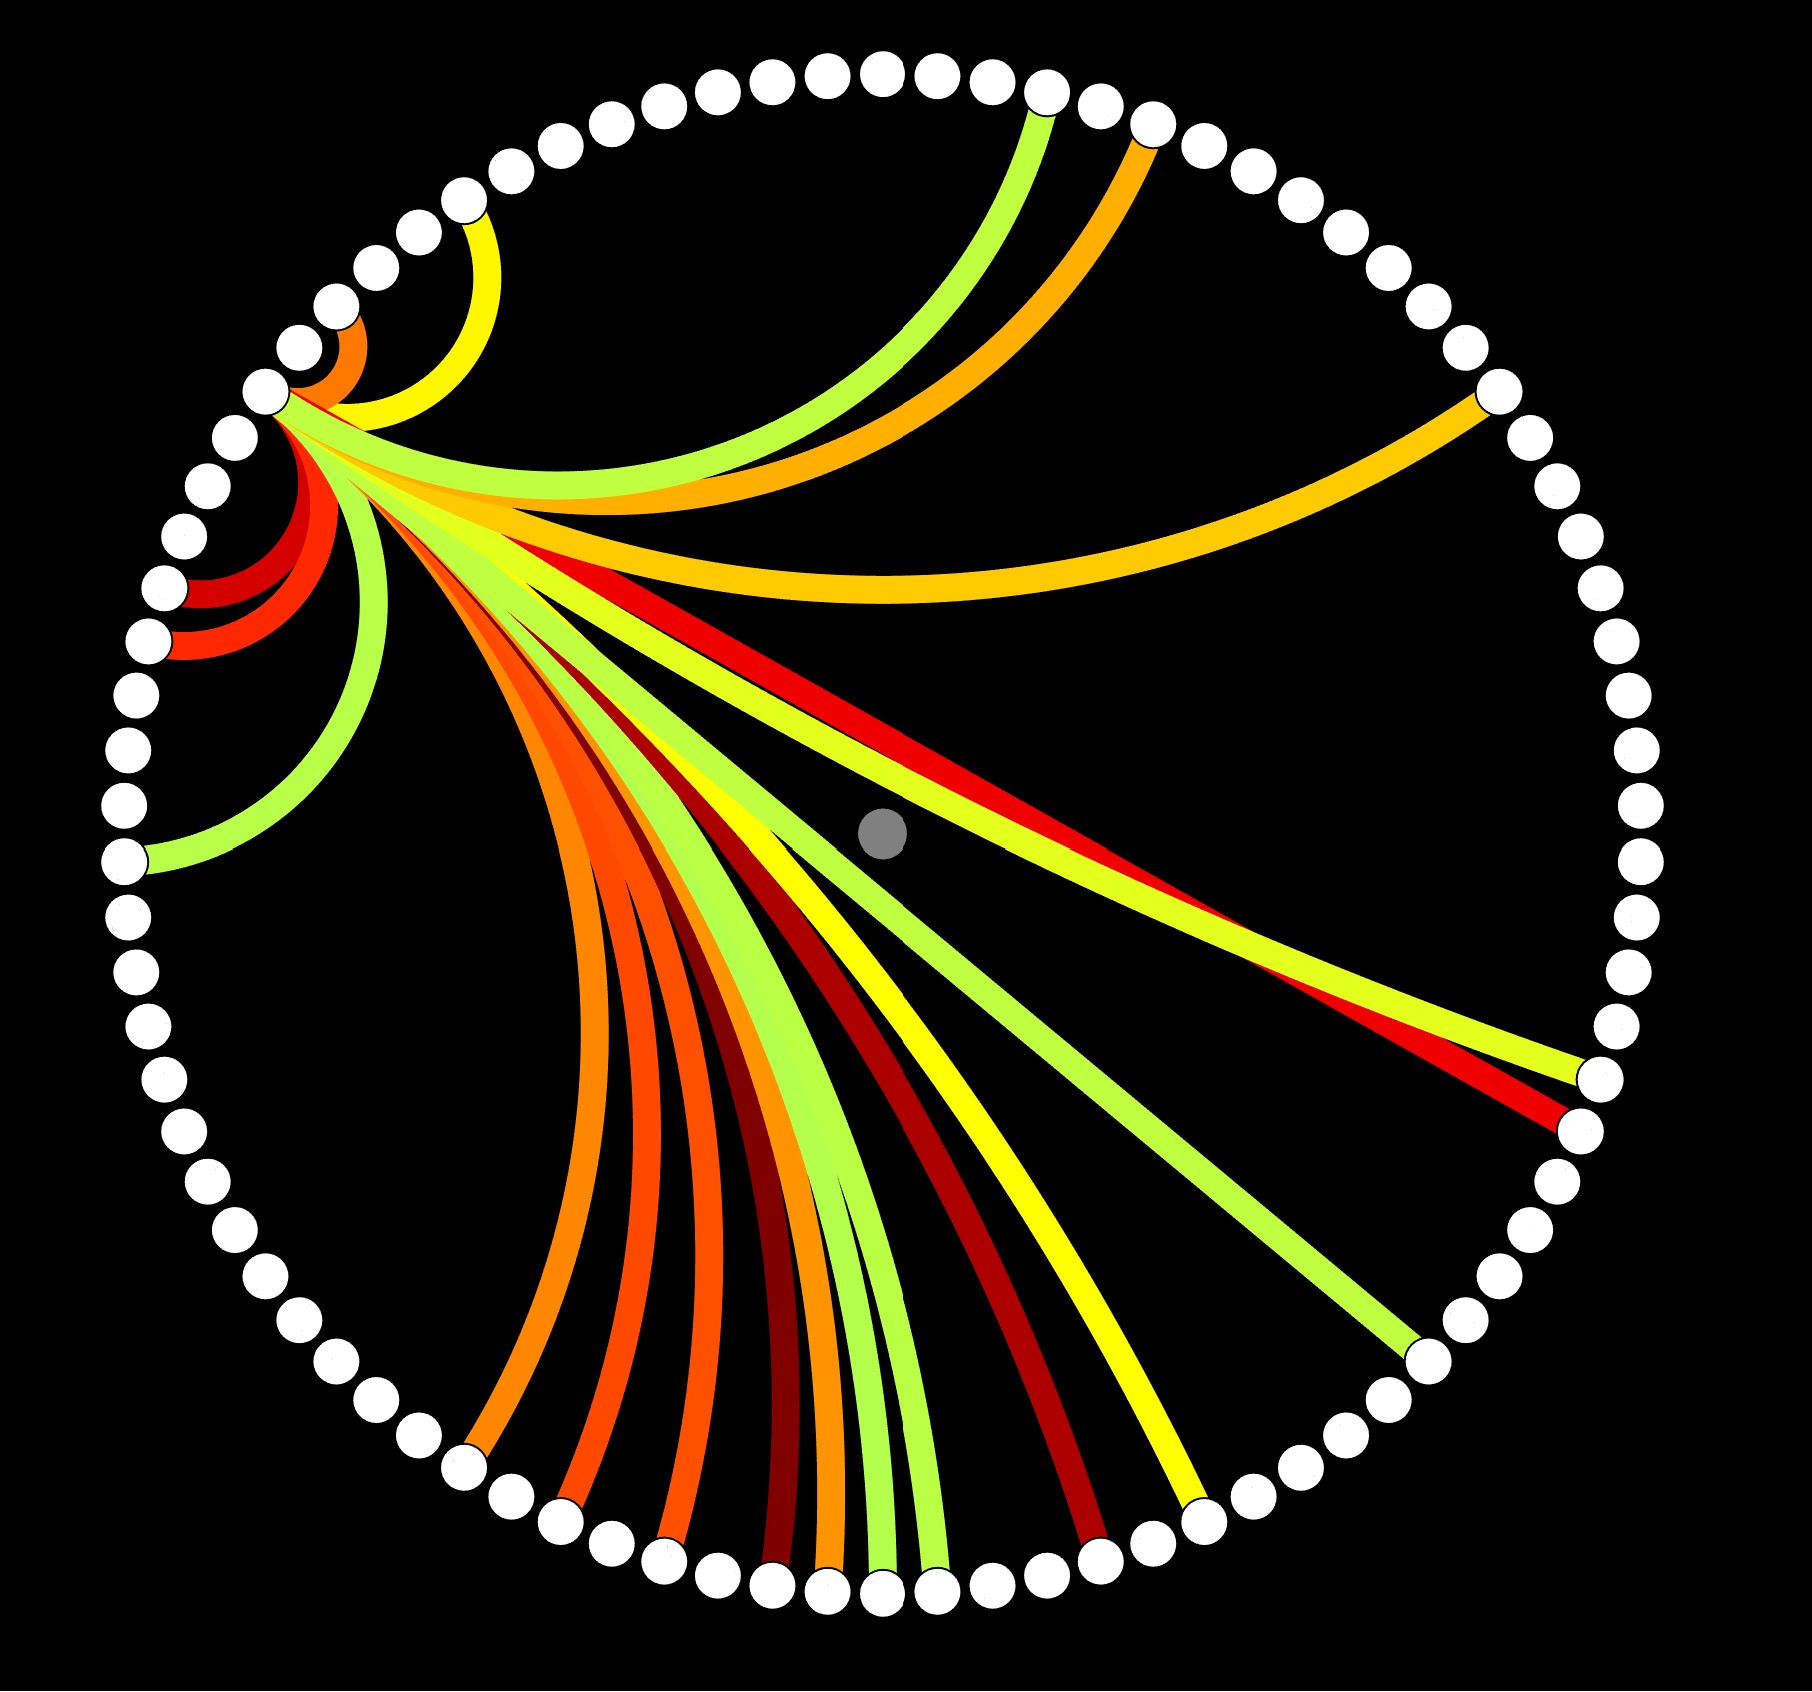
To create the attached figure, I customized figure_connect.m, one of the brainstorm scripts.
Could you let me know which lines in which script I should customize to get a transparent edge in the circular plot?
Best,
Hisato
With a modified code, I cannot tell you where to add the "transparency" feature.
Alternatively, you can run the following lines after creating the figure.
Please note that transparency is not fully supported in the connectivity graph, i.e. there is not color blending, colors just get weaker.
% Alpha level
alpha_level = 0.5;
% Get links in current figure
hFig = gcf;
MeasureLinks = getappdata(hFig, 'MeasureLinks');
% Apply alpha to color of links
arrayfun(@(s) setfield(s,'Color', [s.Color, alpha_level]), MeasureLinks);