I wanted to compute a cluster-based permutation test using the fieldtrip implementation in brainstorm.
I am using MATLAB version 9.9.0.2037887 (R2020b) Update 8 and brainstorm version 3.231129 (29-Nov-2023). Fieldtrip is installed (newest update) and the green button in the plugin tab of brainstorm is shining.
My data ist uploaded in brainstorm. I have 24 subjects and per subject one file. The file is originally a matlab matrix, containing 60 rows (channels) and 8 columns. I use one channel file for all subjects.
I am following the instructions of this tutorial (point 9) https://neuroimage.usc.edu/brainstorm/Tutorials/Statistics#FieldTrip_implementation
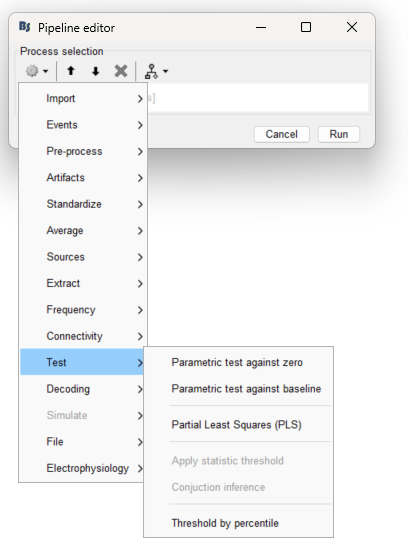
Following this tutorial I loaded my data of interest (all 24 datasets) into the process window. Then I click "Run" and then "Test".
But in the "Test" tab the fieldtrip implementations do not show up (see photo)
In other tabs (e.g. "Sources" or "Connectivity") fieldtrip functions do appear.
I am now wondering, whether there is something wrong with the input data. What input format is needed to compute cluster-based permutation tests using fieldtrip?
Or is it possible that my fieldtrip implementation is not working correctly?
I would be very happy, if you could help me solve this problem!
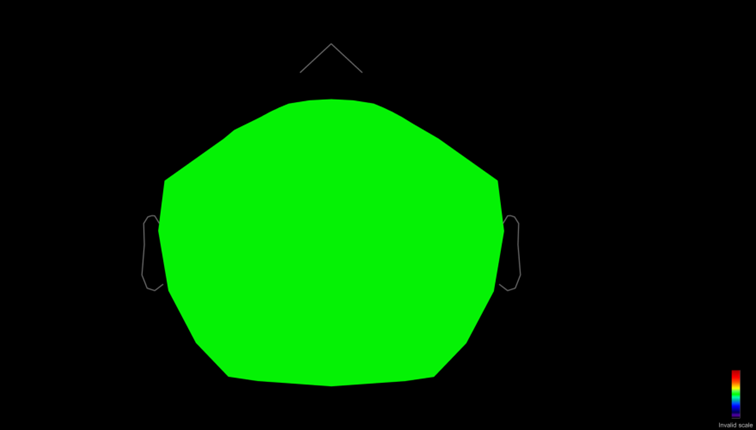
When I have now computed the cluster-based permutation test and want to see the distribution of the clusters based on the channels nothing appears. So what I am doing is double click on the file, which appears after the calculation of the statistics. Then with right click I chose EEG > 2D Sencor cap.
What arises is a completly green head, telling me, that the scale is invalid.
The “Invalid scale” label appears as it was not possible to find an adequate scale for the data. It could be that all the test results a p-value larger than the threshold, so there is not data to show (impossible to scale). Some of the things you can do:
If your statistics are time-resolved, try to plot also the time series, and set the marker to a point where there is statistically significant results. For example (a figure from the tutorial mentioned in the previous post). As you can (hardly) see the sensor caps from 50 and 100ms are all white and show Invalid scale as there are no values to plot.
Change the Significance level α in the Stat tab, so modify the data that is plotted.