Hi,
I was wondering how to compute coherence between behaviour / EMG with each of 12,000 brain locations (from source estimations) and then see it on a head model/map?
thank you.
Hi,
I was wondering how to compute coherence between behaviour / EMG with each of 12,000 brain locations (from source estimations) and then see it on a head model/map?
thank you.
Hello
You can use the Process2 tab. Place your recordings with your behavior/EMG signal in Files A, and the source file in Files B.
Then run the process coherence AxB, and enter the name of the channel for which you want to calculate the coherence.
If you have only one channel selected for FilesA (source channel A), you will be able to display the results as cortical maps.
Cheers,
Francois
Thanks Francois.
I was wondering how to get a matrix of all locations at each time?
Also whether I could get the phase information when I do a coherence analysis?
Thank you
The coherence is not a time-resolved measure.
If you have two signals with N time points each, the coherence of the two signals will give you many values for the frequency dimension, but without any time dimension.
The coherence function is the following: C = Gxy/sqrt(Gxx*Gxy); % Gij being the the cross-spectrum of the signals #i and #j
The process “Coherence” lets you calculate two metrics from this coherence function:
If you want to use different metrics, you can edit directly the function bst_cohn.m, after line 206.
Francois
Hi Francois,
If I use scouts in the coherence AxB option, would it use the mean/PCA/max values?
Many thanks,
Damar
Hello,
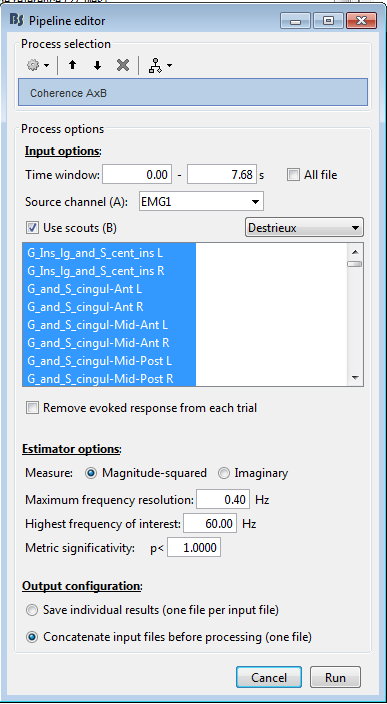
You should be able to select this as an option in the process options.
See the attached screen capture.
Francois
Dear Francois
Thank you for your reply. If I do coherence between a sensor level file and a source level file, I don't see this option.
See the attached screen capture.
Thank you
Hello,
Indeed this case was not considered in the code.
I fixed it, please update Brainstorm and try again (menu Help > Update Brainstorm).
Cheers,
Francois
Thank you very much for this, Francois!
Hi Francois,
How can I plot the topography of coherence for the different scouts?
Thank you,
Ramad
Hi Ramad,
Can you please describe better what you are trying to do?
What do you mean by “topography of coherence for scouts”?
Francois
Hi Francois,
What I mean is if I do coherence A x B for example between a sensor level channel and source level using scouts, I will get a file with a line of coherence for each single scout. Now how can I plot this result, that is showing the level of coherence for each scout on a cortex?
Thank you,
Ramad
If you want to plot the results on the cortex, you would have to calculate the coherence between one channel (FilesA) and all the sources on the cortex (FilesB).
If you limit the calculation to a limited number of scouts, you will not be able to represent it in 3D.
Francois
Thanks for your reply. Is there anyway you could make that possible so that we can compare the amplitudes of the scouts please?
Many thanks,
Ramad
You can display the coherence results as an image. If you click on a value on this image, you get a description of the interaction and its value as a comment at the bottom of the figure.
You can control the amplitude of the colormap used for displaying this image as you would do in any figure (including setting the min/max values).
You can also export your values directly to your Matlab command window (File > Export to Matlab > field .TF).
There you can do all the personal plots or comparisons you need.
What else would you like to be able to display? How else would you like to “compare the amplitudes of the scouts”?
Francois
Hi,
Reviving this topic because I couldn't find any other relevant discussion on this.
I am interested in calculating lagged coherence between speech signal (used as stimulus during the experiment) and source localised MEG data.
I have taken the following steps -
This operation only seems to work for one participant at a time, rather than the entire group. Any suggestions on how I can make this work for the entire group?
Thanks
Everything can be automated with scripts.
This tutorial can help you get started with scripting in Brainstorm:
https://neuroimage.usc.edu/brainstorm/Tutorials/Scripting
Let us know if you get stuck somewhere.
Thats great. Thanks!
Dear Francois,
I have run this analysis now. And we're getting some results as expect. However, one thing I noticed is that the process_cohere2 doesn't allow us to set a lower bound in the frequency domain.
I have filtered the MEG data in 0.5-48Hz but I want to restrict the analysis only to theta band (4-8Hz) or alpha band (8-13Hz). However, process_cohere2 only takes maximum frequency resolution and max frequency as parameters. I set this to 1Hz and 8Hz (for theta band for example). But when the process runs the lower bound is sometimes smaller than 0.5Hz. This doesn't make sense.
Do you have any suggestions on this?
Thanks
Maximum frequency resolution : This value characterizes the distance between frequency bins. Smaller values give higher resolutions but probably noisier.
This has nothing to do with the frequency band of interest.
Highest frequency of interest : All the values higher than this one are computed, but only the ones below this one are saved in the file, to minimize the size of the file and simplify the display.
The coherence analysis is like the PSD process (https://neuroimage.usc.edu/brainstorm/Tutorials/ArtifactsFilter#Evaluation_of_the_noise_level) it computes the values for all the frequencies of the spectrum. If you are interested in the average values over a specific frequency band, you need to apply an additional process after that (Frequency > Group in time or frequency bands, or Extract > Extract values)