Hi Francois,
I have a question about the sources colour maps.
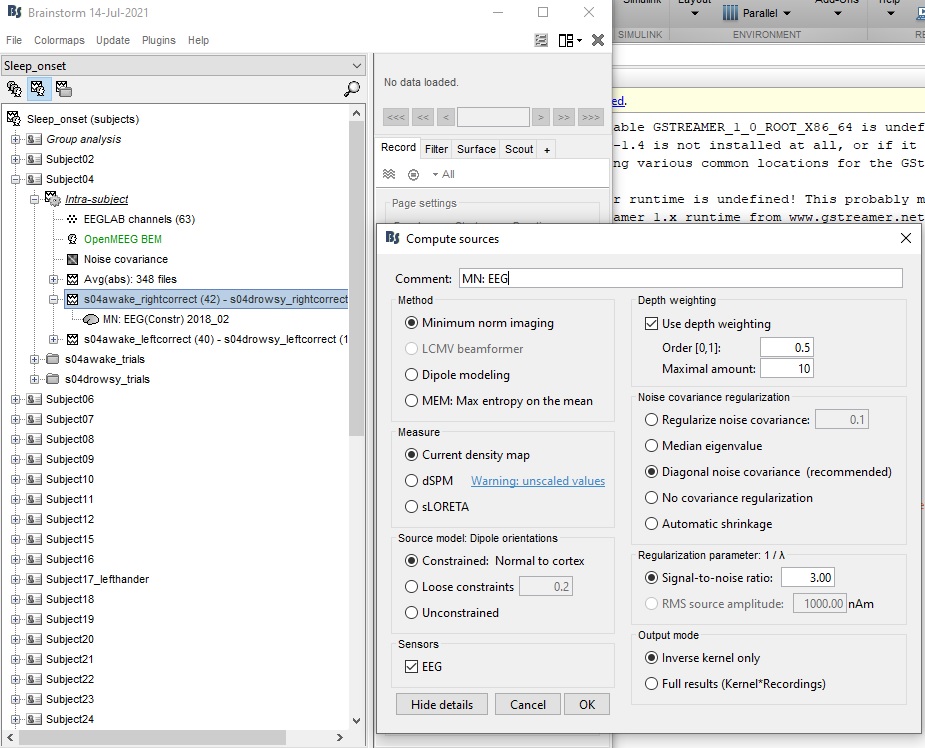
I have used minimum norm estimation to produce a source map of the weighted mean difference (not absolute values) between two conditions "awake - drowsy". I want to select a scout that is more active when awake than drowsy. So, to do this, should I be viewing the source maps using the colour scale default settings (absolute values) or should I be unticking this in the colour maps settings to select a site that is positive on the colour scale (rather than negative on the colour scale). I am unsure as there is a warning that you get when you untick the "absolute values" option.
Thanks for your help - I have included a figure of the warning and the minimum norm estimation settings I have used.
I have also read the info here under the heading "sign of constrained maps" but I am unsure if this answers my question? https://neuroimage.usc.edu/brainstorm/Tutorials/SourceEstimation
Many thanks,
When looking at a difference, you want to see positive and negative values. You are right in wanting to uncheck the option "Absolute values" to be able to observe the relative values.
Brainstorm doesn't always track correctly the contents of the source maps files, and may handle the difference of two source maps just like each of the two input files - for which most users would want to to keep the option "Absolute values" enabled.
The warning is telling you not do uncheck this option "unless you know exactly what you are doing".
In this case, you do know exactly what you are doing, therefore you can safely ignore it
Thank you so much for your reply. I am very grateful for your help!
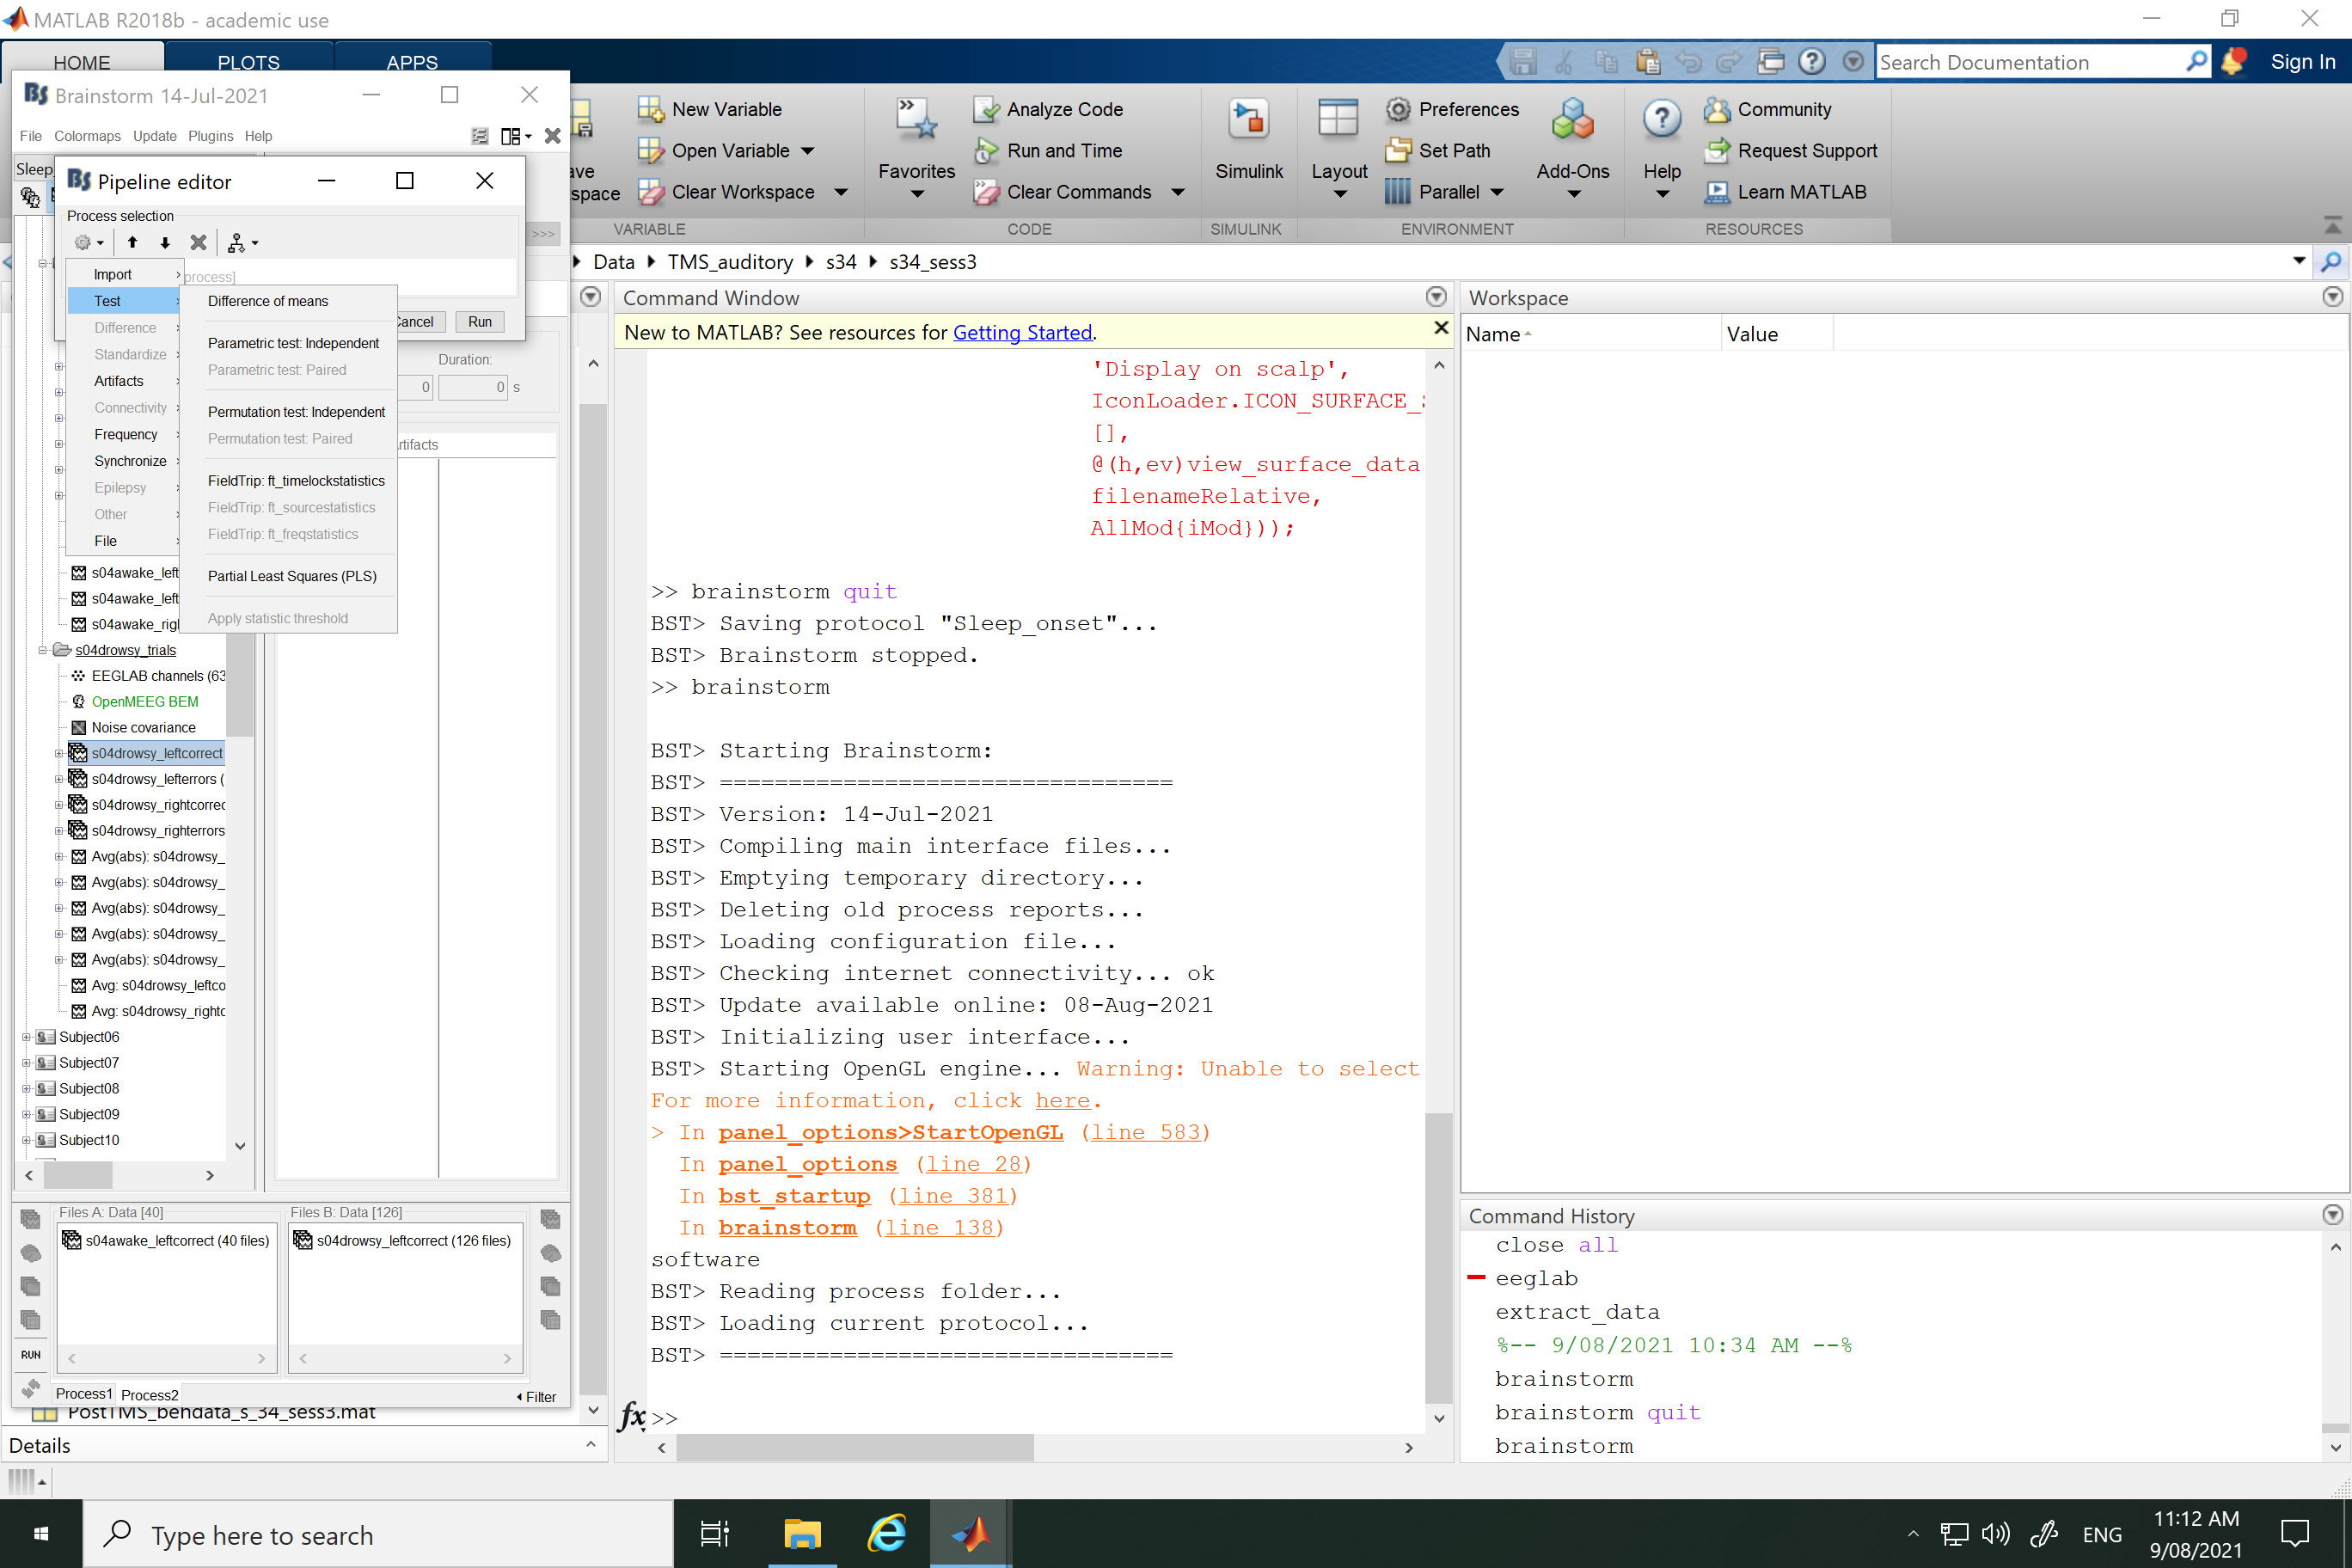
I have a quick question about the "Test - Difference of means" approach that I have taken to compare the awake and drowsy conditions in source space.
I want to understand which sources are statistically significantly different between awake and drowsy conditions for each of the individual participants. So, in other words, for each individual I want to choose a scout that is statistically more active in the awake than drowsy trials. To do this, I originally aimed to do a paired samples ttest in brainstorm to produce a source map with the statistical differences, However, because there is a different number of trials in the awake and drowsy conditions, brainstorm will not allow me to run a paired samples ttest - this option is greyed out. There is an option for an "independent samples ttest" but given the awake and drowsy data is coming from the same individuals, this does not seem the best approach.
So, my question is, is the "Test-Difference of means - difference of weighted means" a good approach?
How should I best demonstrate the sources that are statistically more active in awake than drowsy trials for each individual?
Thanks so much for your insight!
Corinne
Hi Francois!
Thanks so much for your help
I have followed the steps for
Statistics: Group analysis, within subject
|A| = |B| : Parametric or non-parametric
First-level statistic : Rectified and normalized subject averages.
Proceed as in Average: Group analysis to obtain two averages per subject: Ai and Bi.
Second-level statistic : Parametric or non-parametric two-sample t-test, paired, two-tailed.
This test does not consider the sign difference within a subject, and therefore cannot detect correctly when A and B have opposite signs. Works well and indicates which condition has higher values when A and B have the same sign within a subject.
So, following this instructions:
Proceed as in Average: Group analysis to obtain two averages per subject: Ai and Bi. Which says:
Subject averages : Compute within-subject averages for all the subjects, as described above.
So from the Average: Single subject instructions I first followed these steps:
Sensor average : Compute one sensor-level average per acquisition run and per condition.
Sources : Estimate sources for each average (constrained, no normalization).
I did not do this step 3:
Source average : Average the source-level run averages to get one subject average.
because there was only 1 source-level average for each condition (in other words, steps 1 and 2 gave me Ai and Bi)
then I did:
5. Normalize the subject min-norm averages: Z-score wrt baseline (no absolute value).
Justification: The amplitude range of current densities may vary between subjects because of anatomical or experimental differences. This normalization helps bringing the different subjects to the same range of values.
From there, I went to Average: Group analysis:
2. Rectify the cortical maps (process: Pre-process > Absolute value).
Justification: Cortical maps have ambiguous signs across subjects: reconstructed sources depend heavily on the orientation of true cortical sources. Given the folding patterns of individual cortical anatomies vary considerably, cortical maps have subject-specific amplitude and sign ambiguities. This is true even if a standard anatomy is used for reconstruction.
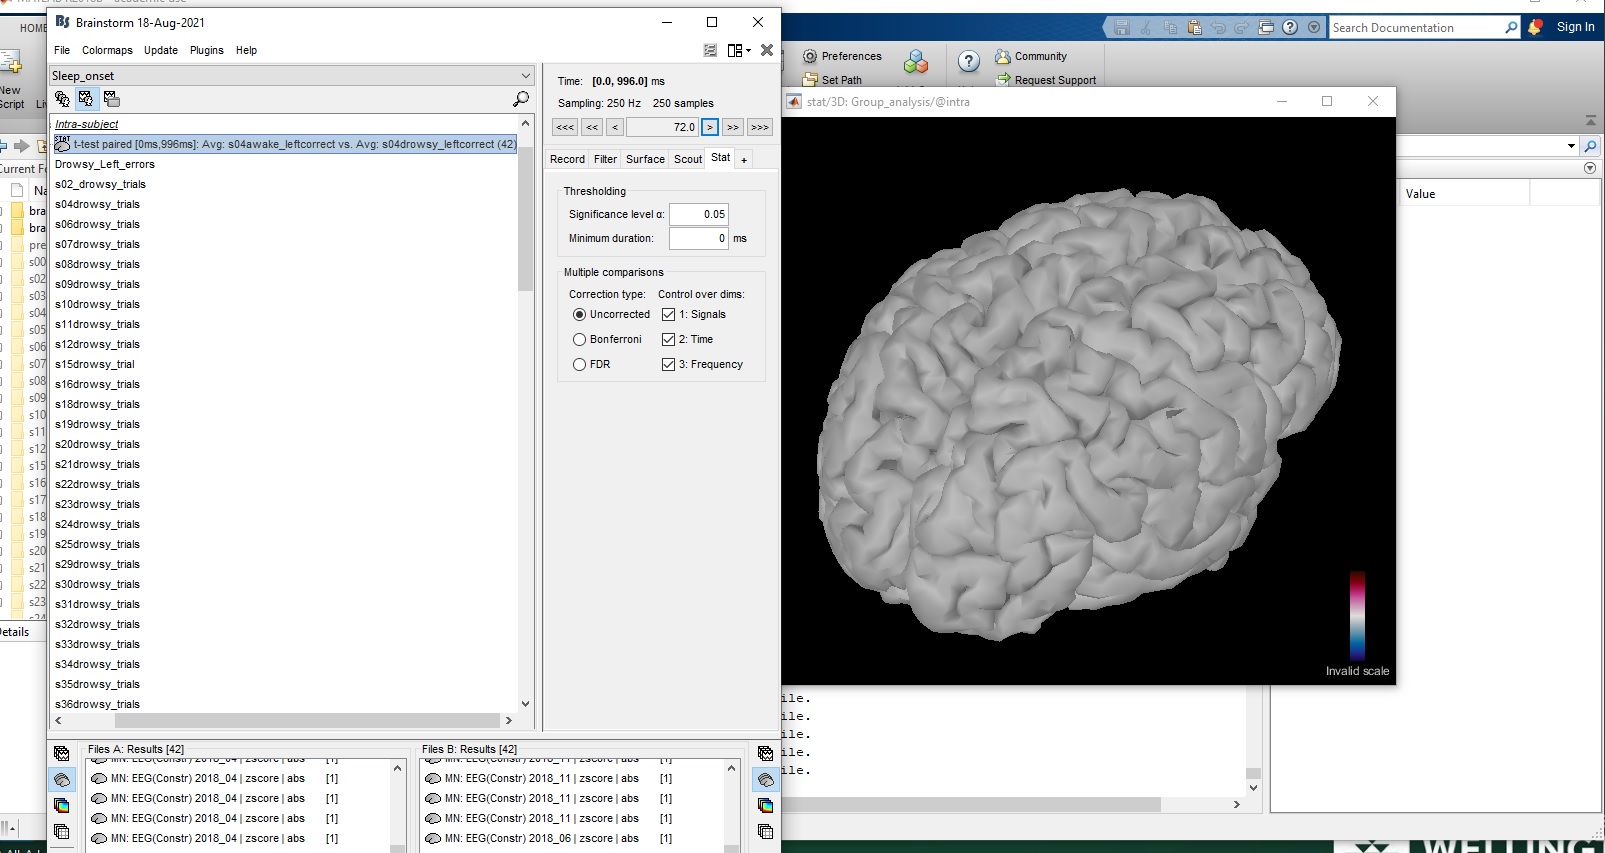
I then submitted these source averages to a paired samples ttest. Unfortunately, when visualising the cortical activations it says: "All values are null. Please check your input file."
So, I am not sure where I have gone wrong here? Should I not have done the 5. Normalize and 2. Rectify steps?
I then submitted these source averages to a paired samples ttest. Unfortunately, when visualising the cortical activations it says: "All values are null. Please check your input file."
Then you may not have any significant difference between your two sets of files?
In the Stat tab, set the "significance level alpha" to 1, in order to check that your maps of p-values make sense.
You could also keep the same file selection and run the process "Test > Difference of average", just to make sure you observe the effects you expect to see (but without any notion of "significance")
You can simply compute subject average PSD maps in source space for each condition. Your atlas (whether it is Destrieux or else) of scouts should be same in the source space for all subjects. Then you can drag all the avg PSD maps of each subject in Process A for Awake and avg PSD maps for Drowsy condition in Process B. This way you will be able to select equal number of files in both tabs and can run paired permutation t-test. Keep all the options e.g. time window, freq bands, source modal options etc. same when you compute PSDs. In the end you will be able to see parametric contrast of two conditions corrected significant or uncorrected scouts. You can do it for different freq bands or single freq depending on your interest.
Hi Francois,
Thanks for your reply. When you set the significance level alpha to 1, there is still no map of p-values and the result is the same "all values are null".
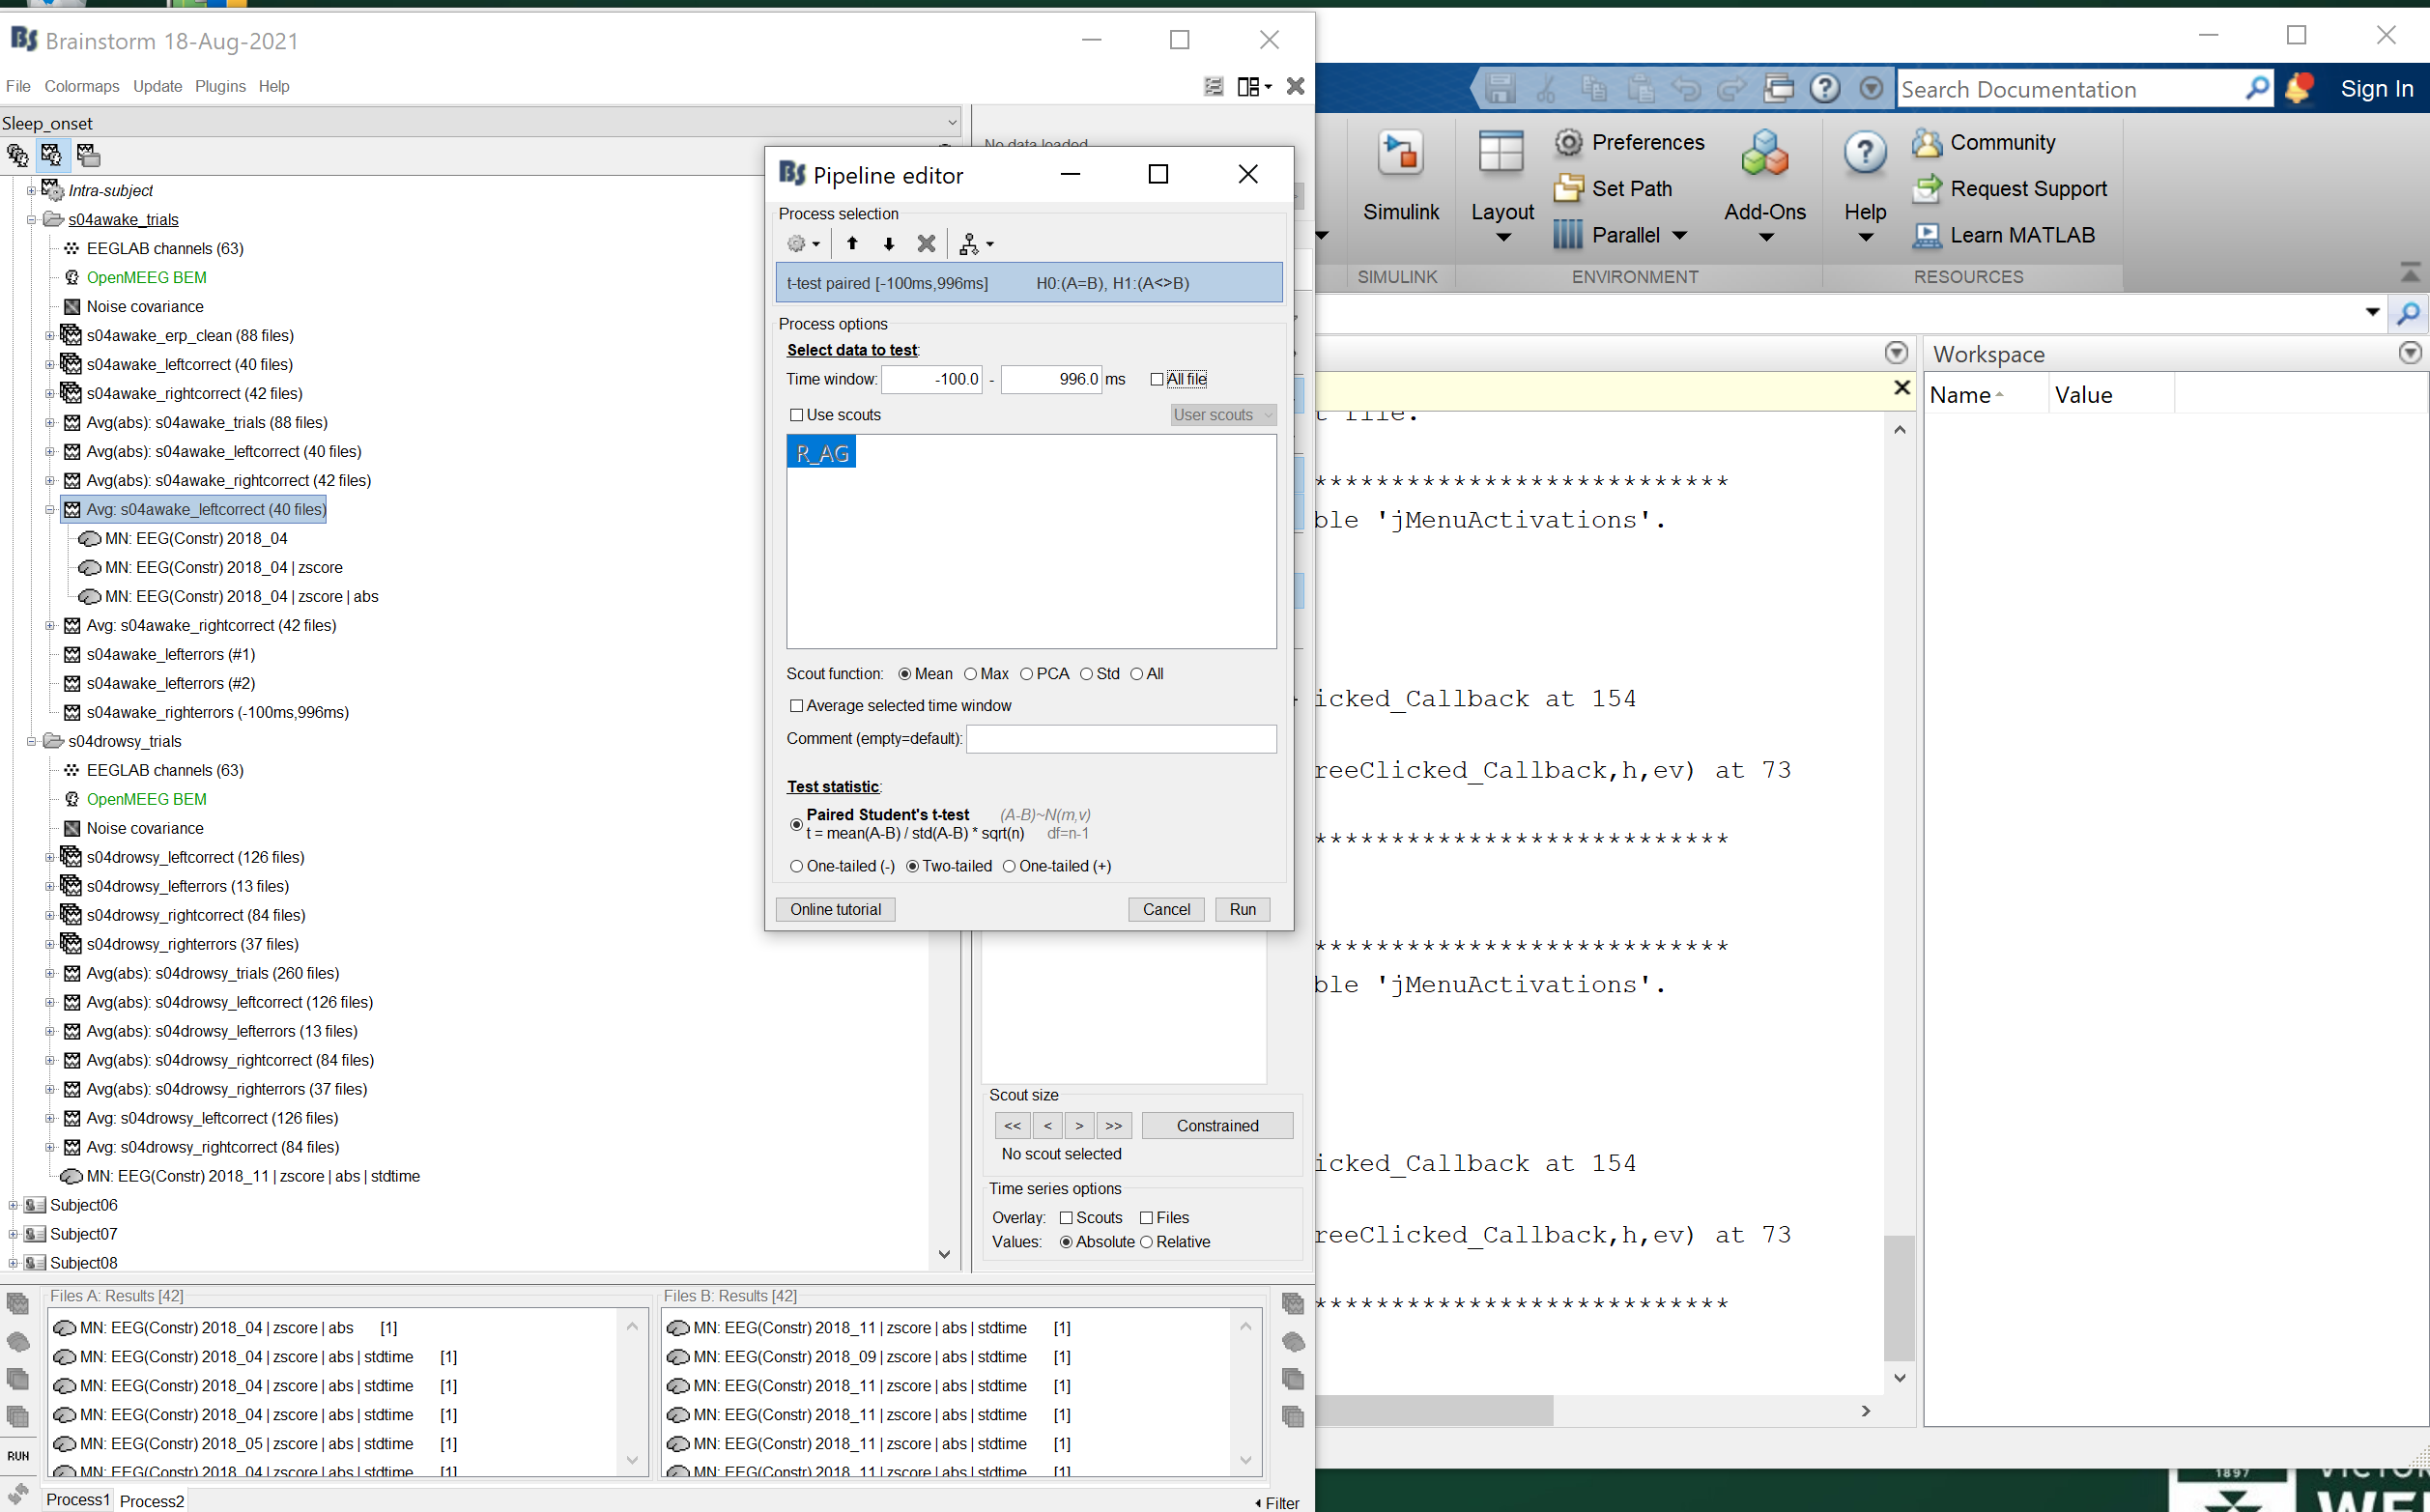
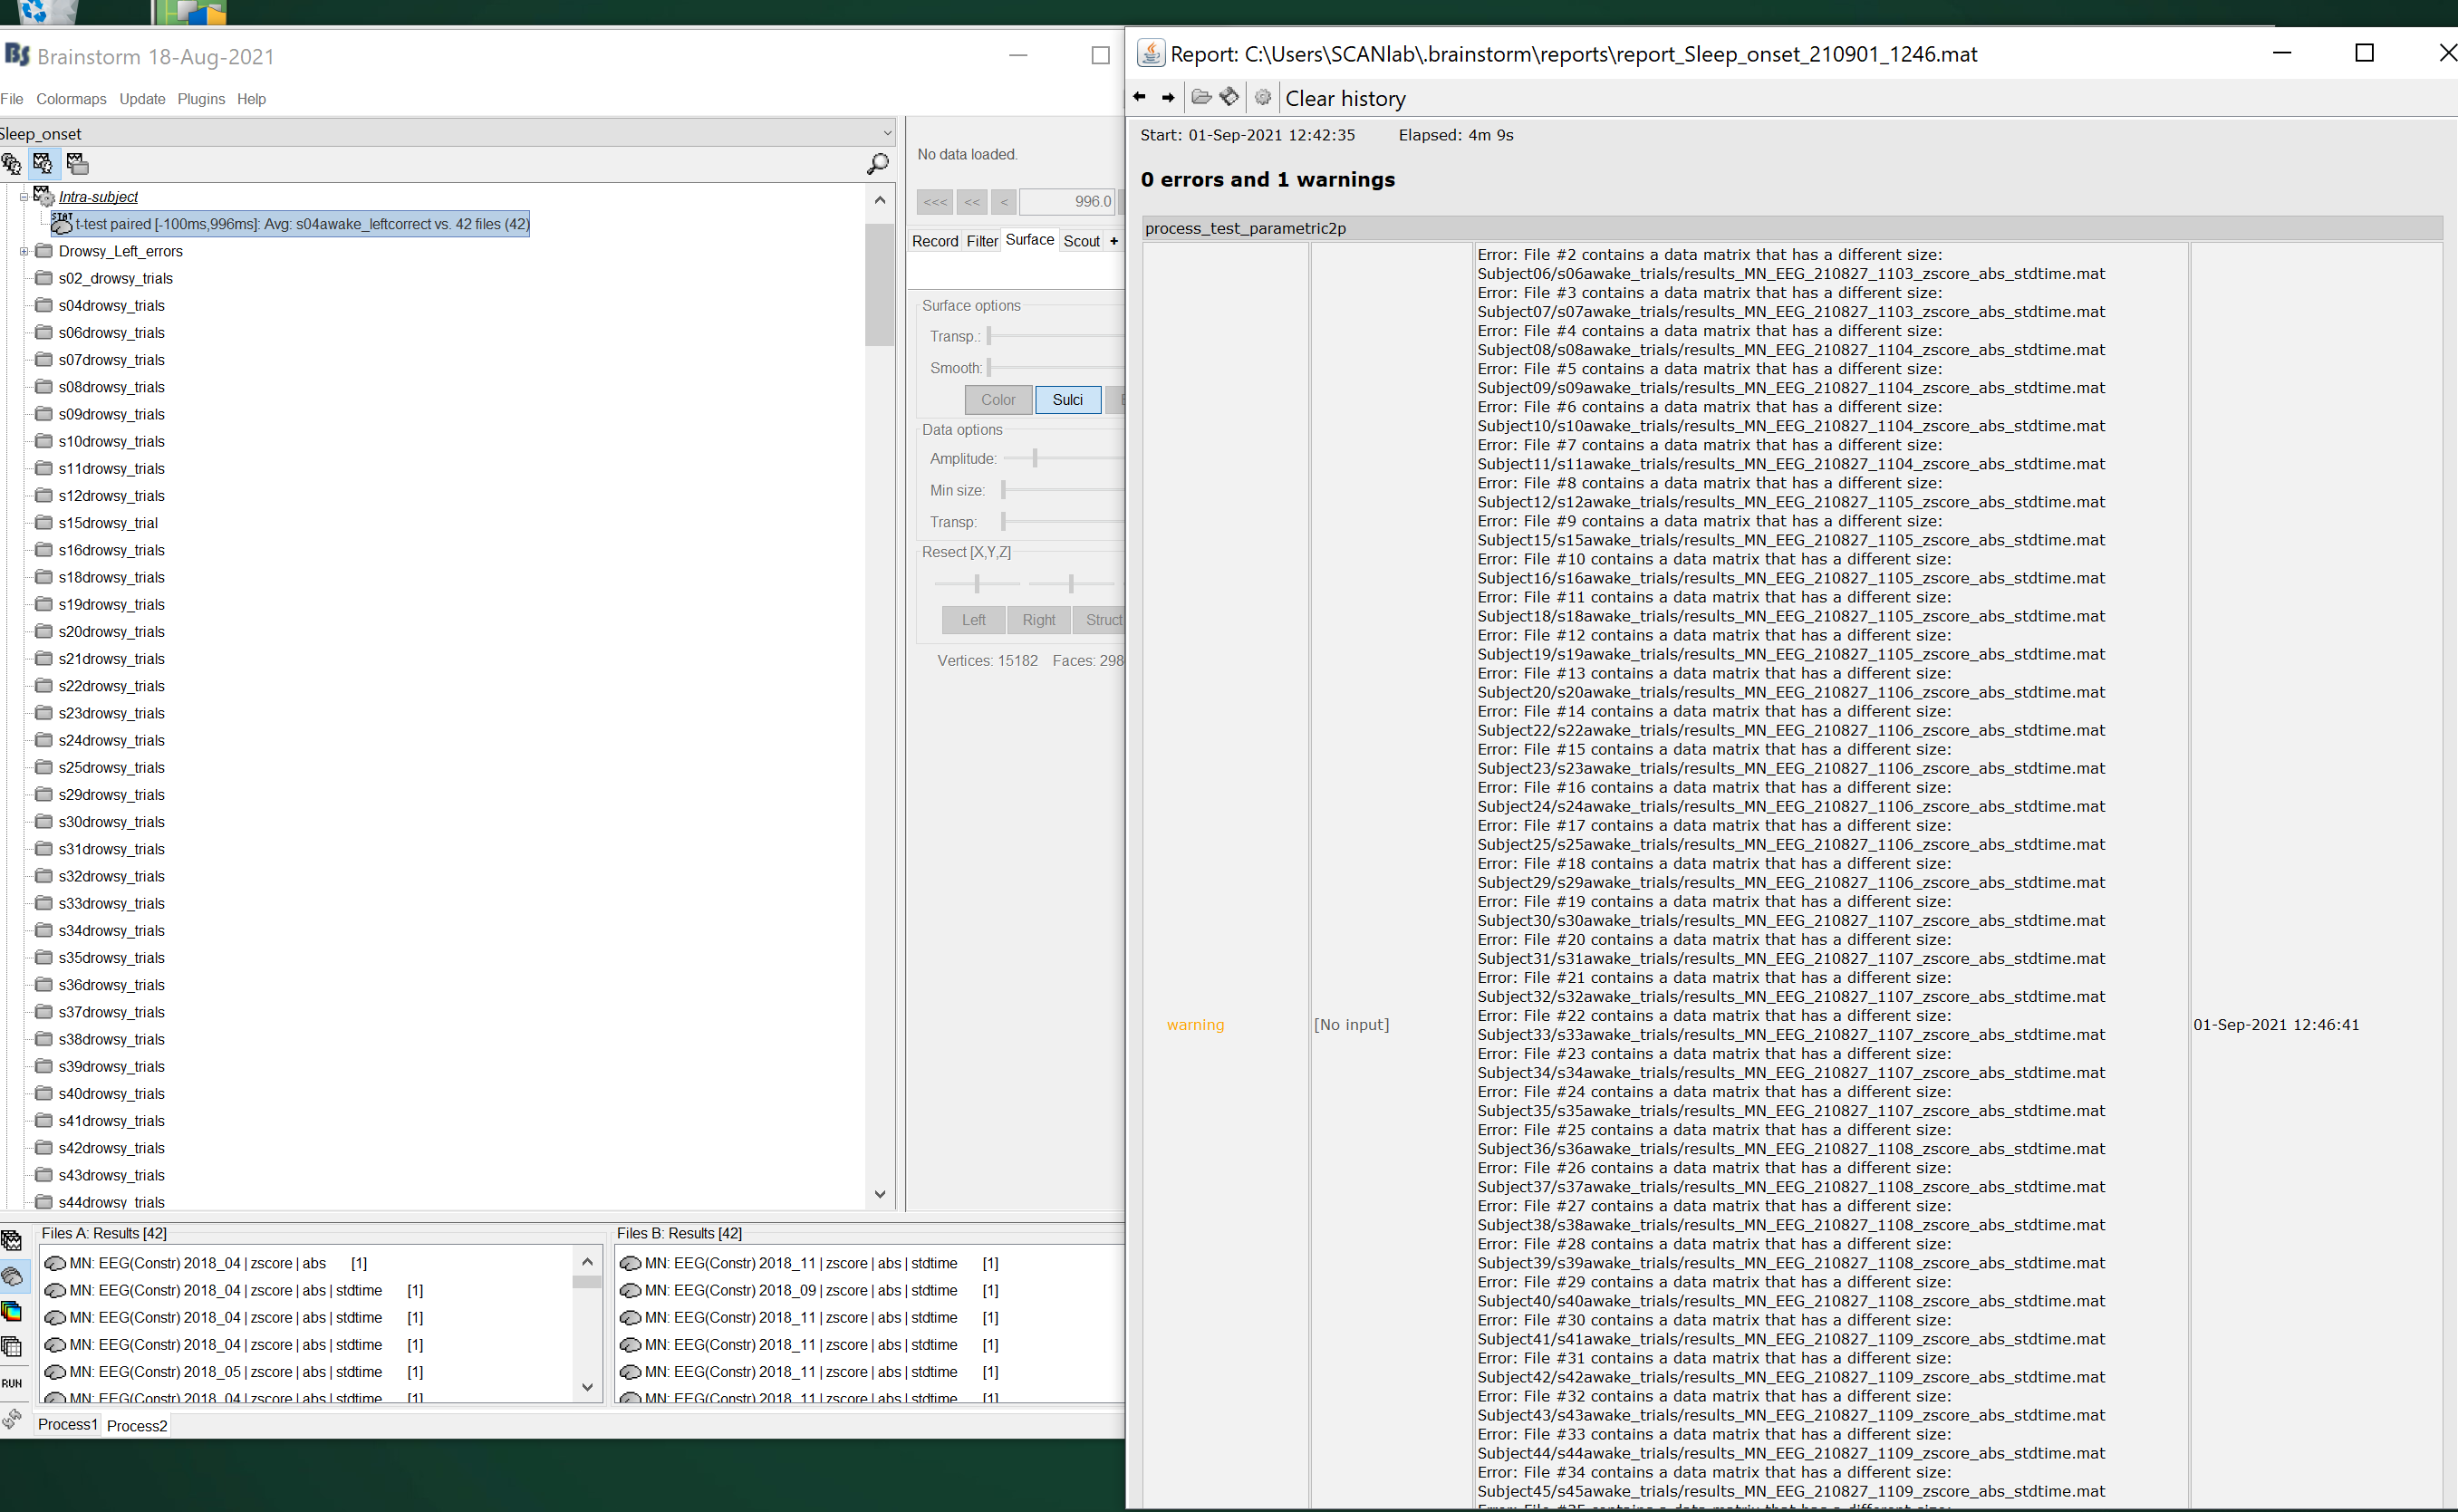
There is a warning that comes up after running the paired ttest saying "File 2 contains a data matrix that has a different size" - it gives this warning for all the files apart from the first one (File 1). This seems odd to me as I am running the paired ttest on the normalised rectified source-level subject averages as described above.
The Test > Difference of average" works well however and I can see the expected effects.
The Test > Difference of average" works well however and I can see the expected effects.
This is with the exact same list of files selected in Process2, right?
This suggests that the files have matrices of the same dimensions.
This process does not do any checks on the contents of the files, if only averages whatever is in input. While the statistical test processes allow the sub-selection of time windows, signals of frequency bands.
There is a warning that comes up after running the paired ttest saying "File 2 contains a data matrix that has a different size" - it gives this warning for all the files apart from the first one (File 1). This seems odd to me as I am running the paired ttest on the normalised rectified source-level subject averages as described above.
This seems to indicates that there are some issues in the selection of the input data in the process. Your input files may have different time definitions. If you can't open the files simultaneously, this means that you need to fix the time vector of the files first. You can do this with the process: Standardize > Uniform epoch time (ideally, you'd do that at an earlier stage in your analysis).
Or it could be due to another option in the test options. Please post screen captures of the options in the Pipeline editor.
Hi Francois,
In response to your questions above,
"This is with the exact same list of files selected in Process2, right?"
Yes that is correct! I left the same files in process 2 and ran Test - Difference of means and had no problem with this process or viewing the results.
"If you can't open the files simultaneously, this means that you need to fix the time vector of the files first."
I can view the cortical activations simultaneously, no problem there. I ran the Standardize > Uniform epoch time process anyway but this doesn't seem to have resolved the issue.
I confess, this has me completely stumped. I have attached screenshots below as you requested.
Please zip 4 source files together: the two first you selected in Process1/FilesA + the two first you selected in Process1/FilesB
To get a direct access to a file on your hard drive, right-click on it > File > Show in file explorer.
Your source files have different numbers of dipoles = your cortex surfaces have different numbers of vertices.
If you are using individual brain scans and not anatomy templates, then the cortex surfaces don't match and you need to project them onto a template before any group analysis.
With the files you sent me, it is not possible that the output of the "Difference of average" was correct. You probably had similar warnings or errors generated on the way.
I have been working on the ttest analysis on my data. I wondered whether there is an option to do an individual independent ttest that takes sign into account. So, if for example, the sign is positive in the awake condition and is negative in the drowsy condition at the same timepoint, this will still yield a significant pvalue on an awake vs drowsy ttest? From what I have read, the ttests in brainstorm do not take sign into account and only compare the amplitude of absolute values?
Thanks for your help,
Corinne
Statistics: Single subject
A = B : Parametric or non-parametric
Compute source maps for each trial (constrained, no normalization).
Parametric or non-parametric two-sample t-test, independent, two-tailed.
Identifies correctly where and when the conditions are different ( sign not meaningful ).
Directionality : Additional step to know which condition has higher values.
Compute the difference of rectified averages: |avg(Ai)|-|avg(Bi)|
Combine the significance level (t-test) with the direction (difference): See details.
Statistics: Group analysis, within subject
|A| = |B| : Parametric or non-parametric
First-level statistic : Rectified and normalized subject averages.
Proceed as in Average: Group analysis to obtain two averages per subject: Ai and Bi.
Second-level statistic : Parametric or non-parametric two-sample t-test, paired, two-tailed.
This test does not consider the sign difference within a subject, and therefore cannot detect correctly when A and B have opposite signs. Works well and indicates which condition has higher values when A and B have the same sign within a subject.
From what I have read, the ttests in brainstorm do not take sign into account and only compare the amplitude of absolute values?
You can test whatever you want, relative (=positive/negative) or absolute values.
You also have this section:
Statistics: Group analysis, within subject
A = B : Parametric or non-parametric [anatomy template only]
First-level statistic : Normalized subject averages (not rectified, no projection needed).
Proceed as in Average: Single subject to obtain two averages per subject: Ai and Bi.
Second-level statistic : Parametric or non-parametric two-sample t-test, paired, two-tailed.
Applies only if all the subjects are sharing the same template anatomy.
Not recommended when using individual anatomies because of the sign issue between subjects (the signs might be opposed between two subjects, and the projection of non-rectified values to a template might be inaccurate).
However, there are limitations in what is meaningful in terms of sequences of processing steps.
As explained in the Difference tutorial, the sign of the minimum source maps is ambiguous and can't be expected to mean the same thin across subjects. https://neuroimage.usc.edu/brainstorm/Tutorials/Difference
If you are lost with these sign questions or if you think none of the proposed pipelines make sense in your case: run your statistical analysis at the sensor level, get a reliable estimate of the latencies with significant differences between your conditions, and look at the dSPM source maps at these time points to get an idea of the location of the brain sources.