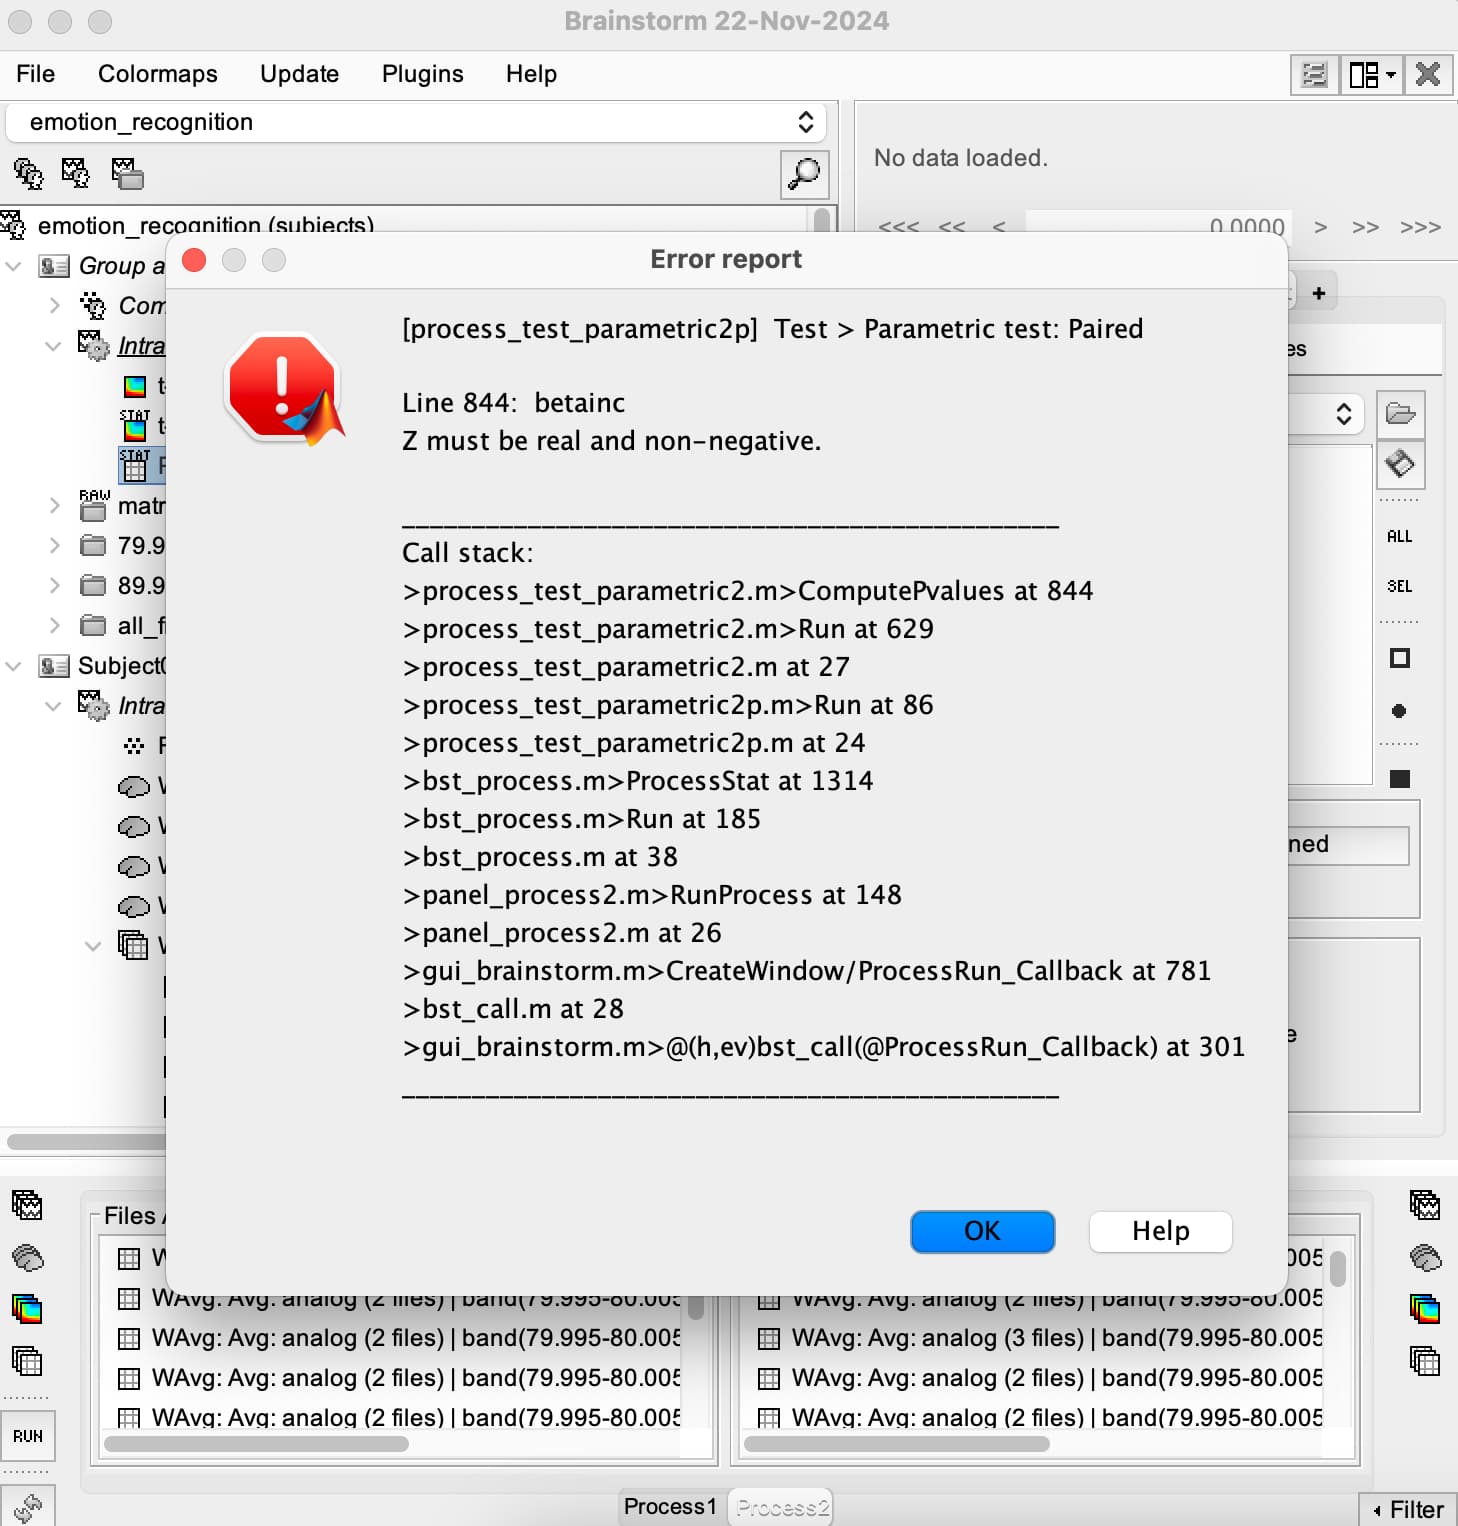
I'm considering comparing the source differences between left and right hemisphere within same experimental condition and same time window, using paired t-test. (for example, brain activation of left insular VS activation of right insular)
I referred to official tutorials, but that was comparing between different experimental conditions. (different with my task design; my design only has 1 condition)
At this point you should have a 2 matrix files for each trial, one with the time series for scout RegionA and one for the scout RegionB. And you can run the paired t-test as indicated in the Statistics tutorial: https://neuroimage.usc.edu/brainstorm/Tutorials/Statistics
Thank you for the answer. Sorry to bother you again, but I have two more questions.
1,
Can I extract several scouts at one time?
Or I'm forced to extract 1 scout at each time?
2,
I have 22 subjects and I want to do the statistical test using all subjects data (scouts for each subjects are the same).
After I extract all the scouts I want, should I need to do average within subject (get the average scout source for each subject) first, and then normalization, and projection onto template or anything?
Or I just drag all those extracted scout source of all subjects into process tab and run paired t-test? And then project the statistical results onto template?
Yes, you can extract for multiple scouts at the same time. Time series for the scouts RegionA and RegionB will be in the same file.
However, if you want to compute statistics of for time series of RegionA vs RegionB. You must have a those time series in different files. Thus, yes it is needed to extract 1 scout at the time.
Normalize the scout time series. At this point different subjects will have the source activity in the same range of values
Projection of the sources (after step 1) is not necessary if the Scouts come from a Atlas. In that case, the Scouts are already a projection from a Default anatomy (where the Atlas is defined) into the Subject anatomy, so the scouts represent the same regions across subjects.
If I want to extract the activity at a specific frequency, can I extract a small time window (very narrow band-pass filter) of the scout series after step 2? Or do the filter after normalization (to avoid “an underestimation of the baseline variance“ according to the Workflows tutorial) ?