Hello,
I found the amplitude of my component topography was the opposite of the example when I practiced your providing data in Part 4 of Tutorial 13 step by step (The data I used was "sample_introduction"). Specifically, the red area and the blue bird area are opposite. My picture is as follows.
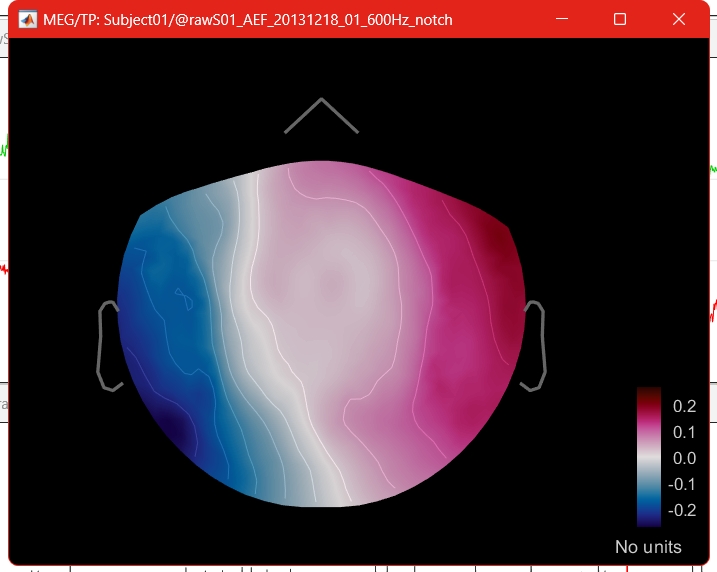
What could be causing this and is there a way to change it? Thanks a lot.
Shuo