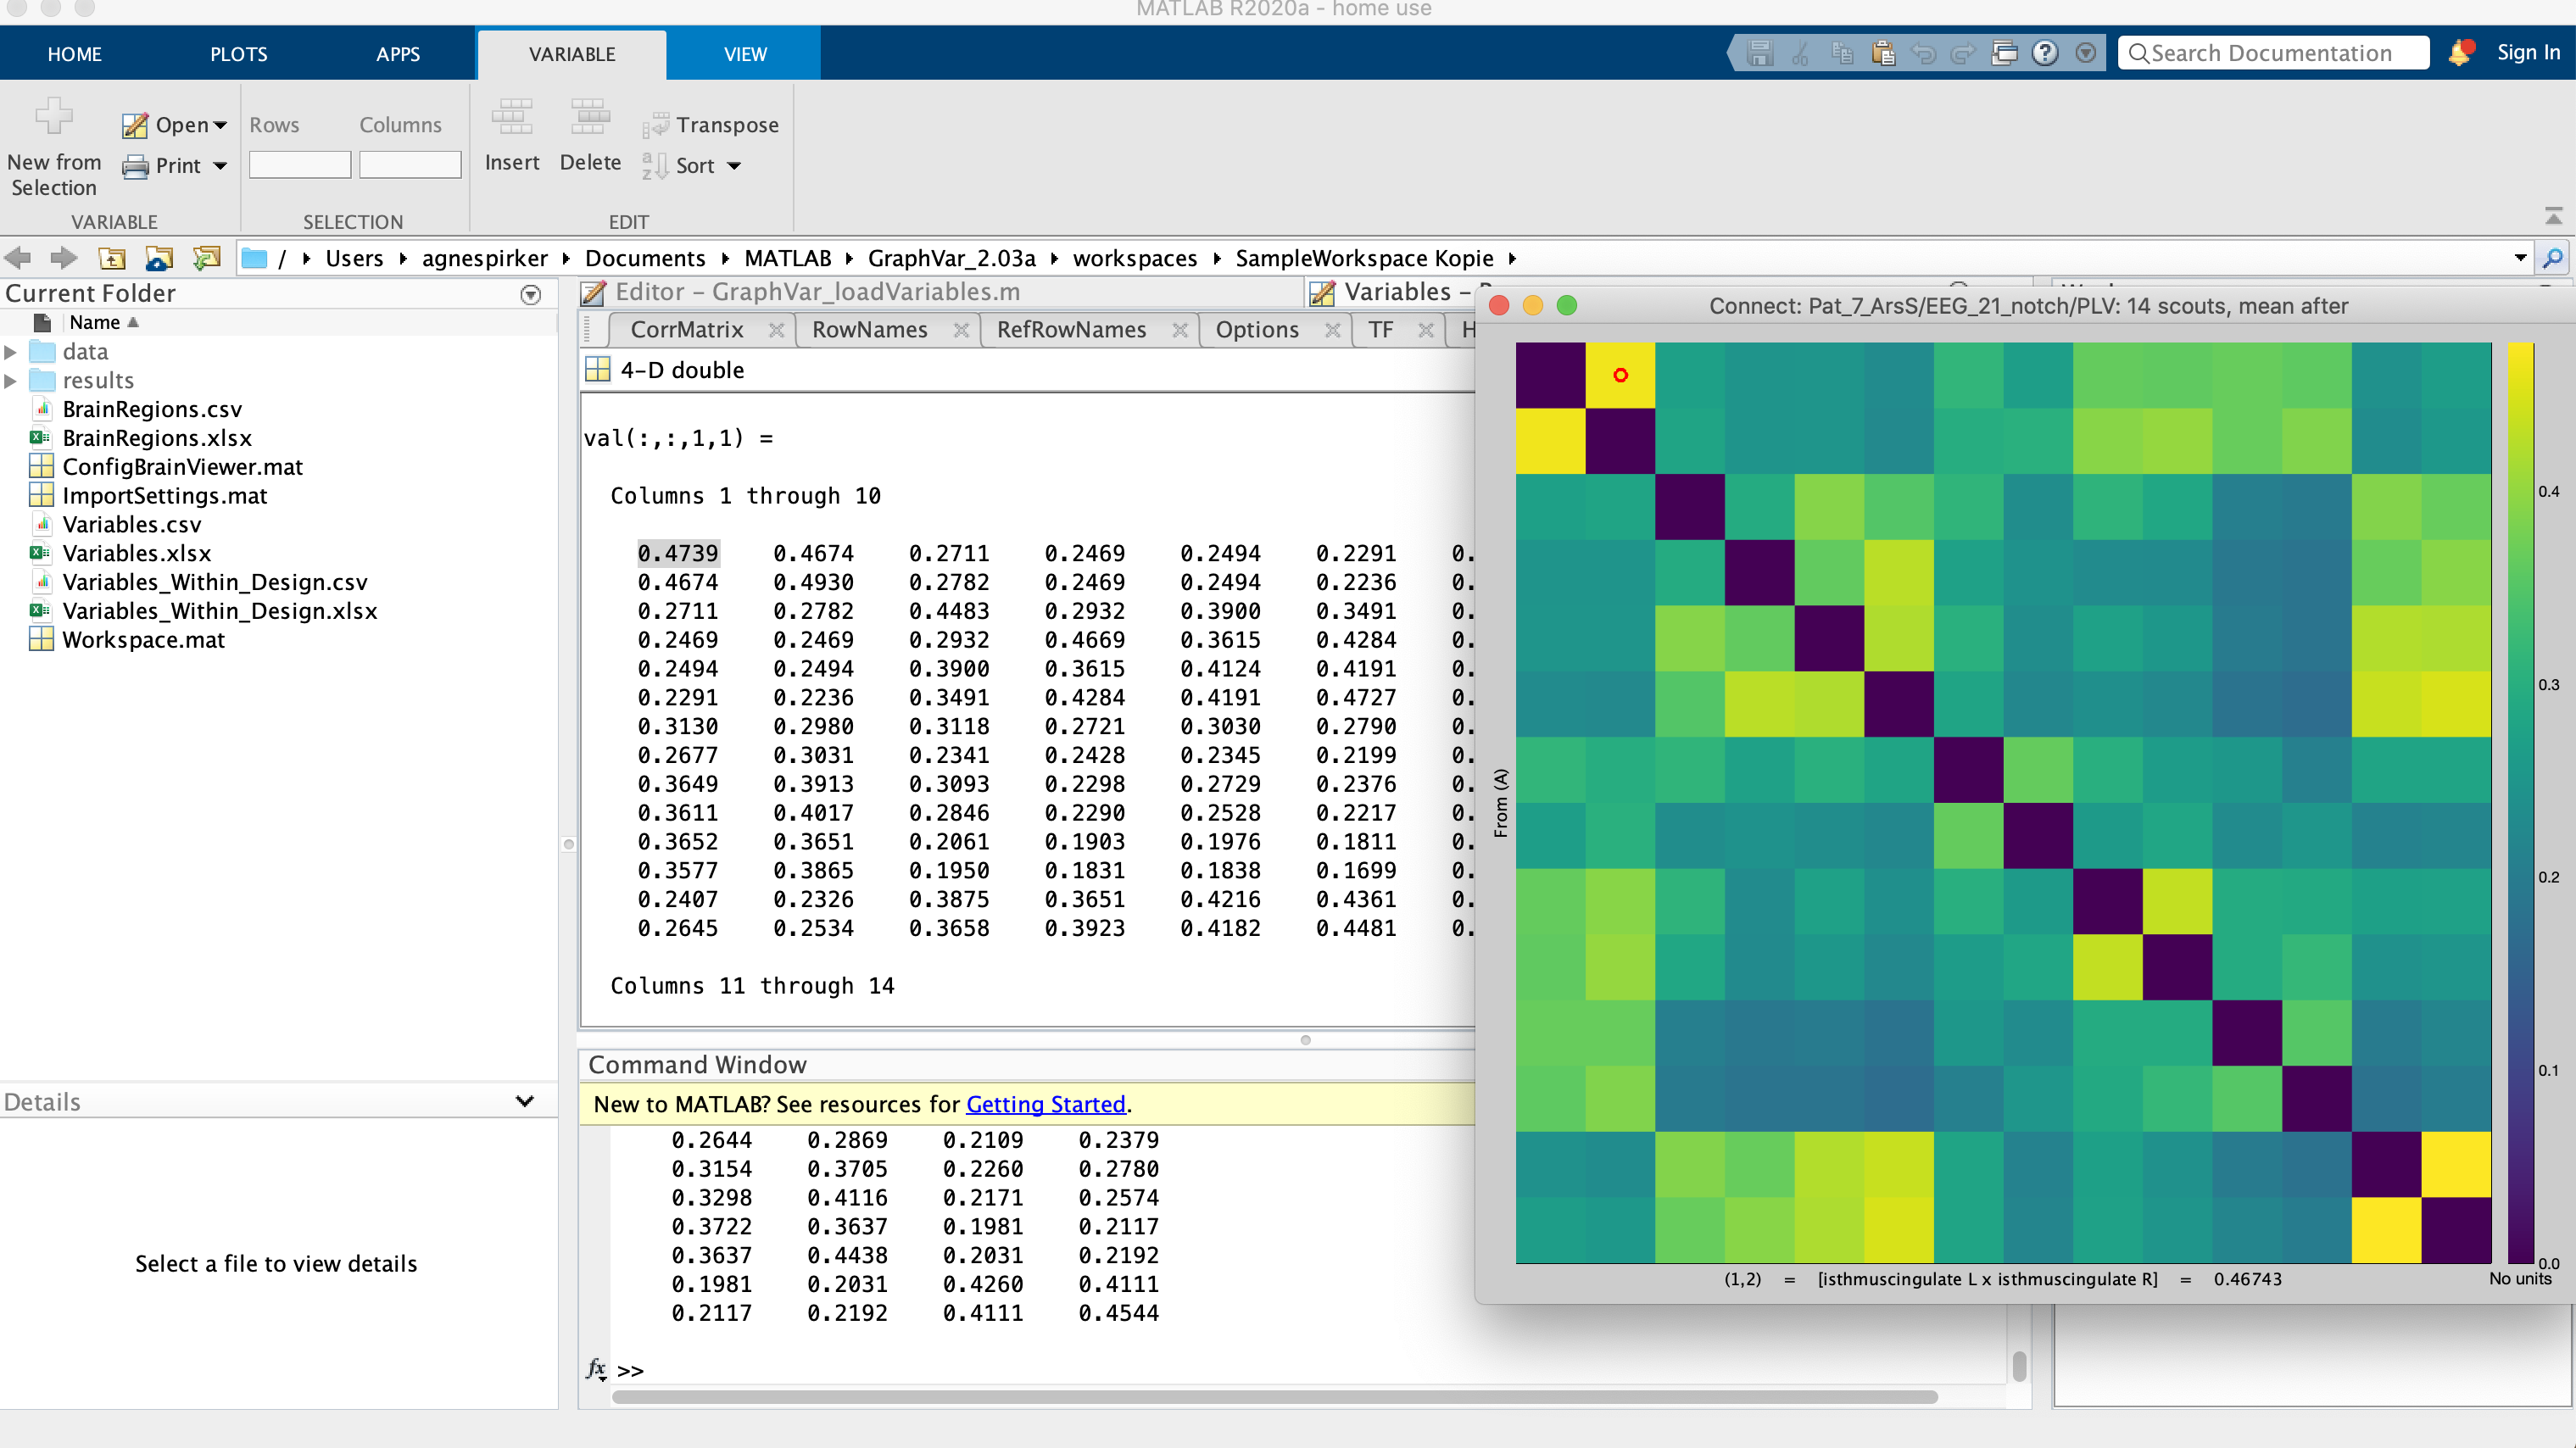
We think we stumbled across a bug when exporting our PLV connectivity matrix (14x14) to a CSV file.
The matrix is displayed correctly in Brainstorm, so the diagonal values equal 1 but when exporting it to CSV, the diagonal values are not 1. All other values match in the matrix in Brainstorm and the CSV file.
Are we missing something here regarding data formats?
The PLV of a signal with itself is 1, indeed.
However, the title of the figure shows that you used scouts, and that you selected the option "Scout function: MEAN / AFTER". The PLV(scout,scout) is not necessarily 1.
If you have Nv vertices in your scout, the process computes first the [Nv x Nv] matrix of PLV values = all the pairs of vertices within your scout. Then it applies the selected scout function on all these Nv*Nv values. If you selected MEAN, it computes the mean of many values among which only the diagonal is 1, all the other values are <1, therefore the mean is < 1.
PLV(scout,scout) = mean([PLV(scout(1),scout(1)), PLV(scout(1),scout(2)), .....)]) < 1
Thank you very much for your explanation Francois. So is it recommended to use mean before? To my understanding that might lead to some information getting lost.
Another question popped up: if the matrix with MEAN / AFTER has values that are not 1 in the diagonal, why is the visual representation of the matrix with a diagonal = 1 as seen in the screenshot above?
Would it be possible to just replace the diagonal with 1 in the exported file?
So is it recommended to use mean before? To my understanding that might lead to some information getting lost.
I'm sorry, we don't have generic recommendations for the moment.
Connectivity analysis is a complicated topic, especially at source level.
For the moment, we offer the tools for users to play with without strict guidelines.
Another question popped up: if the matrix with MEAN / AFTER has values that are not 1 in the diagonal, why is the visual representation of the matrix with a diagonal = 1 as seen in the screenshot above?
It is not a 1 that you see in the diagonal, it's a ZERO, or more exactly an absence of data, so that it doesn't force scaling the colormap to 1 if the other values are much lower.
We are currently working on finalizing our connectivity tutorial, maybe some of these details will be adjusted as we go.
Would it be possible to just replace the diagonal with 1 in the exported file?
No, not if this is not consistent with the way the other values are computed.
The fact that you don't have a zero is informative of how much you lose by using this "after" option.