Hi
Is there a scripting process available to for creating clusters? I have pre-selected EEG sensors within several regions of interests. I would like to group them into clusters for several averaged files.
Best
David
Hi
Is there a scripting process available to for creating clusters? I have pre-selected EEG sensors within several regions of interests. I would like to group them into clusters for several averaged files.
Best
David
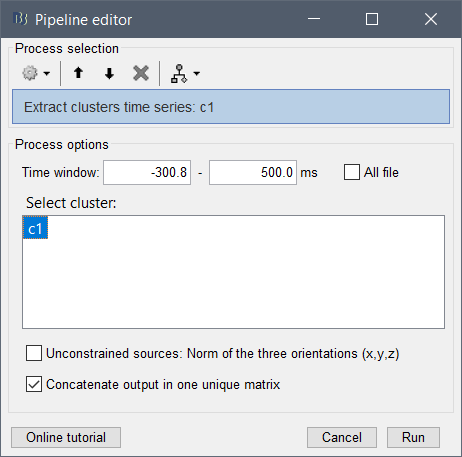
The easiest is not to define explicitly your clusters, but to use directly the processes that will use this clusters (eg. "Extract > Clusters time series") from a script.
Create a example cluster, then generate the script corresponding to extracting the time series of this cluster (or any other process that uses clusters in inputs). You'll see that you can edit directly the list of channels you want in your cluster in the process call.
Example:
Corresponding call:
% Process: Extract clusters time series: c1
sFiles = bst_process('CallProcess', 'process_extract_cluster', sFiles, [], ...
    'timewindow',  [-0.30078125, 0.5], ...
    'clusters',    struct(...
         'Sensors',  {{'O1', 'O2', 'P7'}}, ...
         'Label',    'c1', ...
         'Function', 'Mean'), ...
    'isvolume',    0, ...
    'isnorm',      0, ...
    'concatenate', 1, ...
    'save',        1, ...
    'userowname',  []);
Thank you Francois
Hi Francois,
Is it possible to use this approach to show the cluster for two groups in one image? My aim is to obtain an image that would allow comparison between two groups for the same cluster. I was able to use the below script to get the cluster images for my 6 ROI (clusters) for the groups but can't overlay these images either with the script (I tried adding a line sFiles2 for the other group)) or in Brainstorm. When I highlight the two images of the same cluster for the two groups and right-click I get file > View histogram (and the other export, cut,delete options).
Also, currently the images come out with the y-axis set to 'Amplitude (10-7)', where -7 is superscript. I've been looking for a way to set it to the normal scale but can't see it?
for iROI = 1:length(S_11)
ROIData_11 = S_11(iROI).ROI_Sig_11
ROI_label = S_11(iROI).Region
% Process: Select files using search query
sFiles1 = bst_process('CallProcess', 'process_select_search', [], [], ...
'search', '(([type EQUALS "Data"] AND [name CONTAINS "HLG"] AND [name CONTAINS "Avg: WAvg:"] AND [name CONTAINS "11_right"]))');
% Process: Extract clusters time series: c1
sFiles5 = bst_process('CallProcess', 'process_extract_cluster', sFiles1, [], ...
'timewindow', [], ...
'clusters', struct(...
'Sensors', {ROIData_11}, ...
'Label', ROI_label, ...
'Function', 'Mean'), ...
'isvolume', 0, ...
'isnorm', 0, ...
'concatenate', 1, ...
'save', 1, ...
'userowname', []);
end
Is it possible to use this approach to show the cluster for two groups in one image? My aim is to obtain an image that would allow comparison between two groups for the same cluster.
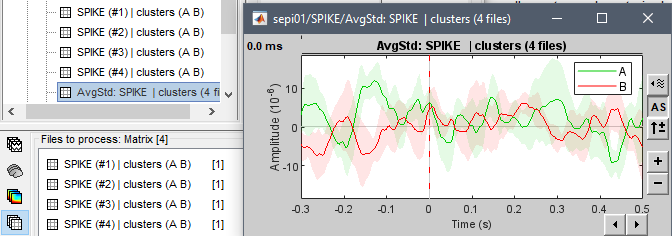
If you select the average files for the TWO groups simultaneously in Process1 (or select them both with your database search) and call the process "Extract > Extract clusters time series" with the option "Concatenate output in one unique matrix" selected: this would save all the two signals in the same file.
Otherwise, if you have multiple files with one signals in each, you can select them all in Process1 and call the process "Extract > Extract values" with the option "Concatenate signals: Dimension 1 (signals)" selected.
Also, currently the images come out with the y-axis set to 'Amplitude (10-7)', where -7 is superscript. I've been looking for a way to set it to the normal scale but can't see it?
These are the actual values in the file. The units are not saved in these "matrix" files, therefore the units is not applied. If you want to modify the graph directly, right-click on the figure > Figure > Plot edit toolbar, and then use the Matlab tools to edit the legend. Or use Matlab function xlabel().
Hi
In the above script I have ROI_label after 'label' to add the ROI to the labels for two groups in my cluster graphs. This is a for loop to input my 6 ROI terms onto the labels. These gives a label in the graph like - FCL @ Group-analysis/ERP-avg/data-11-right-average-201013-average-201013-2142.mat for one groups and something similar for the second group label. FCL is an ROI.
Is there a way to get the names of the two groups (CG and HLG) into these labels and delete the part beginning with @? I have numerous cluster graphs so this would be very handy. The ROI applies to both group labels within one graph but I'm not sure how to apply two different (group) terms appropriately to the tow labels within the same graph.
I'm sorry, what you describe is a bit difficult to follow not having the data in hand or any graphics representing the data or the file names... I don't understand if you are trying to modify the figures or the data structures.
Please post screen captures illustrating step by step what you would like us to help you do.
Thanks
Hi Francois,
In the struct file for averaged files or graphs which field are the x ('/muv') and y labels ('Time (s)') stored in? I generated ERP graphs as above. You advised I could use MatLab tools to change the axis labels. I have a large number of these graphs and was looking for a way to automate it. The x-axis has Time (s) but y-axis has just numbers. I tried searching the struct file for 'Time (s)' but can't find it.
The labels of the X and Y axes are defined in the file figure_timeseries.m. This information is not saved in the data structures. Look for the text in that function if you want to see where and how this is set.
The simplest option would be to use the xlabel and ylabel Matlab functions to edit the labels from a script.
PS: Please create new threads for new questions.
Hi Francois,
Previously, I was able to use the extract cluster process to generate graphs of the mean value for a cluster of channels across time. However, I am now trying to incorporate the standard deviation into this graph and I am unsure of the best approach.
For my analysis, I have two groups with 128 channels each. In order to generate my previous (mean only) graph, I obtained the value for the clusters (from select channels which vary across analyses) from the group averaged files. This worked well, as the mean was consistent regardless of whether the clusters were averaged from the averaged group channel data, or at an individual level with the individual clusters then being averaged to get the group cluster value. However, as the standard deviation is different in these two cases I'm not sure how to include the accurate variation. I can get the standard deviation of clusters using above process but that's for the mean value of clusters that were averaged from the averaged group channel data.
Could advise on how I might obtain the accurate standard deviation, which would be the standard deviation of the mean of the averaged clusters at an individual level (reflecting the analysis I did)? Any suggestions you could provide would be greatly appreciated.
If I understand correctly, the procedure would be the following:
After step #2, you have for one file of the type "matrix" for each subject and each experimental condition.
You can select all these "matrix" files into the Process1 and run the average process with the option "Mean + Standard deviation". You should be able to directly visualize the mean+std by simply double-clicking on the output file.
If this is not the information you are looking for, please post some screen captures to illustrate better your problem.
Note that now the clusters are saved in the channel files, you might have to adjust some of your scripts or procedures:
-
Hi Francois,
Thank you, I'll look at this approach. Is there a way to change the input for the below process so that it is the two groups (group 1 = 10 subject level averaged files, group 2 = 10 subject level averaged files (20 files total)) rather than the group averaged files as below (sFiles5 = group1 averaged file and group 2 averaged file (two files total))? This would work easier in the scripting pipeline I have which adjusts for the changing clusters automatically. I have multiple potential clusters which vary across analyses so I haven't placed these clusters in the subject-averaged files.
sFiles6 = bst_process('CallProcess', 'process_extract_cluster', sFiles5, [], ...
    'timewindow',  [], ...
    'clusters',    struct(...
         'Sensors',  {ROIData}, ...
         'Label',    ROI_Tag, ...
         'Function', 'Mean+std'), ...
    'isvolume',    0, ...
    'isnorm',      0, ...
    'concatenate', 1, ...
    'save',        1, ...
    'userowname',  []);
I'm not sure I understand what is your question about.
Are you asking about how to select files from the database?
You can look at the Search database feature:
https://neuroimage.usc.edu/brainstorm/Tutorials/PipelineEditor#Search_Database
The Scripting tutorial would also help:
https://neuroimage.usc.edu/brainstorm/Tutorials/Scripting
I have two groups (10 subjects in one group and 12 in the other) and I averaged the subject-average files to get two group-averaged files. I am able to run the above script 'process_extract_cluster' on these two group-averaged files to get the clusters mean for both groups in one graph (two lines representing the cluster mean for each group). Is there a way to run this same script instead on the subject-averaged files (10 files / 12 files) to get the mean clusters this way plus the standard deviation? If there is I think it would be easier to adapt my scripts.
I tried to see if this would work using below script where sFiles 1 = group 1 / 10 subject-averaged files and sFiles 2 = group 2 / 12 subject-averaged files.
sFiles3 = bst_process('CallProcess', 'process_extract_cluster', sFiles1, sFiles2, [], ...
    'timewindow',  [], ...
    'clusters',    struct(...
         'Sensors',  {ROIData}, ...
         'Label',    ROI_Tag, ...
         'Function', 'Mean+std'), ...
    'isvolume',    0, ...
    'isnorm',      0, ...
    'concatenate', 1, ...
    'save',        1, ...
    'userowname',  []);
The process "Extract clusters time series" does not accept two inputs (= it is not available from the Process2 tab). I'd recommend you always generate your script calls to bst_process with the menu "Generate .m script" of the Pipeline editor window.
I also recommend you copy the clusters to all the folders you need with db_set_clusters.m and then refer to them only with their labels in your scripts. See this new features described here:
https://neuroimage.usc.edu/brainstorm/Tutorials/ChannelClusters#Scripting
You script calls should look like this:
sFiles = bst_process('CallProcess', 'process_extract_cluster', sFiles, [], ...
    'timewindow',  [], ...
    'clusters',    {'A', 'B'}, ...
    'concatenate', 0, ...
    'save',        1);
Is there a way to run this same script instead on the subject-averaged files (10 files / 12 files) to get the mean clusters this way
Yes, you can call this process on all the subject-level averages.
To get one matrix file in output for each average (e.g. for computing statistics): you can call the process only once with sFiles including all the files from both groups and the option concatenate=0.
To get one matrix file for each condition, with all the individual subjects concatenated: you need to call the process twice, once for each group, with concatenate=1.
plus the standard deviation?
Is this really the standard deviation across electrodes, that you are interested in? Or across subjects?
Thank you. I am trying the approach of calling this process on all the subject-level averages which I would then average to get the group mean+std as you outlined above. The clusters vary at subject level across analyses so I think it would be easier to generate the clusters during the extraction rather than adding them to each folder and then extracting the cluster by label.
The script that I used (below) works at group level on the group averaged files but doesn't seem to work at subject level? When I run it on an individual subject averaged file there's no output or error message
It's across subjects so I would calculate the mean of clusters at subject level and the mean+std at group level.
sFiles6 = bst_process('CallProcess', 'process_extract_cluster', sFiles8, [], ...
    'timewindow',  [], ...
    'clusters',    struct(...
         'Sensors',  {ROIData}, ...
         'Label',    ROI_Tag, ...
         'Function', 'Mean'), ...
    'isvolume',    0, ...
    'isnorm',      0, ...
    'concatenate', 0, ...
    'save',        1, ...
    'userowname',  []);
The options isvolume, isnorm and userowname are not defined for this process process_extract_cluster.
=> Generate a new template for this process call from the Pipeline editor.
'Sensors', {ROIData}, ...
This syntax is maybe resulting in a wrong definition of the list of channels for the cluster, e.g. {{'Cz','Pz'}} instead of {'Cz','Pz'}.
The script that I used (below) works at group level on the group averaged files but doesn't seem to work at subject level?
This would work for any set of files correctly selected in the sFiles input parameter.
The channel files associated to each input file must contain the channel names defined in the cluster.Sensors.
If you can't understand why your syntax is not working:
edit process_extract_cluster.mThank you. The script required the input files to have a cluster field to run so the actual clusters can be generated during the process. I created a dummy cluster in one file and I'm trying to copy this to all files using the set clusters function. I'm getting the below error message.
sFiles = ....(input file containing dummy cluster)

ChannelFile = in_bst_data(sFiles.ChannelFile)

db_set_clusters(ChannelFile, 'AllSubjects')
Warning: Inputs must be character vectors, cell arrays of character vectors, or string arrays.
In bst_get (line 1497)
In bst_get (line 2035)
In db_set_clusters (line 42)
Error using strrep
Conversion to double from struct is not possible.
Error in bst_get (line 1497)
DataFile = strrep(DataFile, ProtocolInfo.STUDIES, '');
Error in bst_get (line 2035)
[sStudy, iStudy, iItem] = bst_get('DataFile', FileName, iStudies);
Error in db_set_clusters (line 42)
[sSrcStudy, iSrcStudy] = bst_get('AnyFile', ChannelFile);
ChannelFile must be a string: the path to a channel path.
db_set_clusters(sFiles(1).ChannelFile, 'AllSubjects')
I recommend you follow the Scripting tutorial, to get more familiar with the naming conventions of the variables in Brainstorm:
https://neuroimage.usc.edu/brainstorm/Tutorials/Scripting
Hi Francois,
As I said above I'm looking to get the group averages (with std err) for both groups in one file. E.g. I have two groups A and B with all subjects in both groups having an averaged cluster file.
I think this approach gives the average for multiple clusters in one group.
I can average (By trial group (grand average)) these subject level averaged cluster files for both groups which results in two group averaged files in output. I am not sure how to get this data into one file - one file which contains a line charting the averaged cluster for each group (two lines in the one file).
sFiles6 = bst_process('CallProcess', 'process_extract_cluster', sFiles5(i), [], ...
    'timewindow',  [], ...
    'clusters',    struct(...
         'Sensors',  {ROIData}, ...
         'Label',    ROI_Tag, ...
         'Function', 'Mean'), ...
    'concatenate', 0, ...
    'save',        1);
I have run this on the subject averaged ERP files. If concatenate is set to one it gives one file with all subject averages but not the group average. Set to 0 it seems to give a separate file for each individual.
I'm not sure what the best approach is to get the file I'm looking for? If there were a way to average all subject level averaged cluster files for group A and B with one output file that might be easiest? Or to extract clusters from the subject level averaged clusters files. The averaged channel/cluster in these files is named the group i.e. the Channel name is Group A or Group B. The script I used doesn't seem to recognize these (sMat and sValues returns empty).