If I understand correctly, the procedure would be the following:
- Compute the subject-level average (invidividual ERP)
- Compute the average of the signals for a list of channels that differs for each subject (Extract cluster time series)
- Compute a group-level mean + standard deviation of these cluster signals
After step #2, you have for one file of the type "matrix" for each subject and each experimental condition.
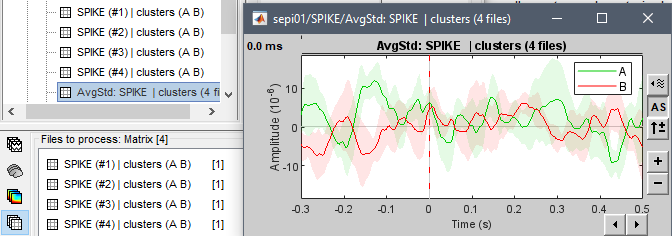
You can select all these "matrix" files into the Process1 and run the average process with the option "Mean + Standard deviation". You should be able to directly visualize the mean+std by simply double-clicking on the output file.
If this is not the information you are looking for, please post some screen captures to illustrate better your problem.
Note that now the clusters are saved in the channel files, you might have to adjust some of your scripts or procedures:
-