@Francois
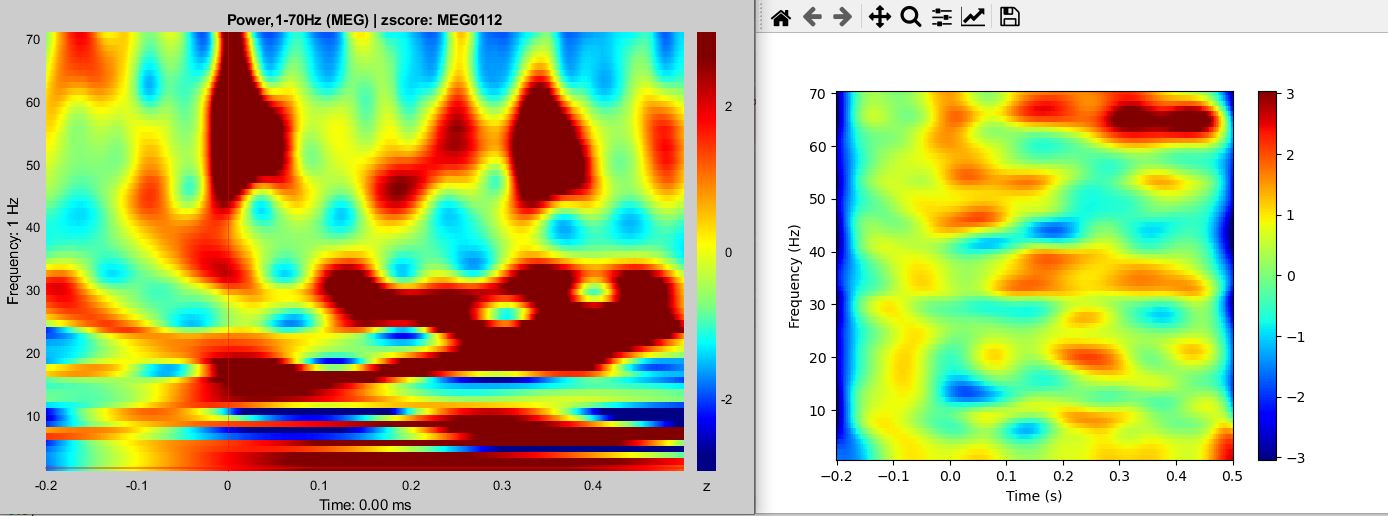
Above is the Time frequency plot obtained for the same sensor in brainstorm(left) and on MNE(right). For brainstorm I computed the Morlet wavelets for the average file of my evoked response and then normalized it using zscore.
For MNE, I used the following:
freqs = np.arange(1,71)
n_cycles = freqs / 5.  # different number of cycle per frequency
power, itc = mne.time_frequency.tfr_morlet(epochs['D5'], freqs=freqs, n_cycles=n_cycles, use_fft=True,  return_itc=True, decim=3, n_jobs=1)

baseline_mode = 'zscore'
baseline = (None, -0.01)

power.plot(picks='MEG0112', baseline=baseline, mode=baseline_mode,cmap='jet')
Why such drastic difference in the TFR?
What is the N_cycle in Brainstorm? Is there a predefined value or can we change it according to our preference? If so, how?
@SubratBastola can you share with @Francois and me the epochs['D5'] as a fif file? epochs['D5'].save('D5-epo.fif)` then send the file written
Alex
@SubratBastola
- Please post results with no baseline normalization
We need to separate differences coming from the wavelet transformation and the ones coming from the normalization.
- Please post screen captures of the time-frequency process options (3 images: the basic options + the advanced options + the figure showing the wavelets)
@pantazis @Alexandre @sherazkhan
Could you please help us establish the correspondence between the Brainstorm parameters and the MNE-Python parameters?
Brainstorm implementation:
MNE-python implementation:
Thanks
Hi @Alexandre, @Francois I am sharing the link to my epoch file
@SubratBastola
Please post the information I requested in my previous post - thanks.