Hi, I'm trying to export the source results from BST and using it for FC analysis. I will present the processes that i thought it should be. Please point anything is wrong to help us. Thanks from my heart.
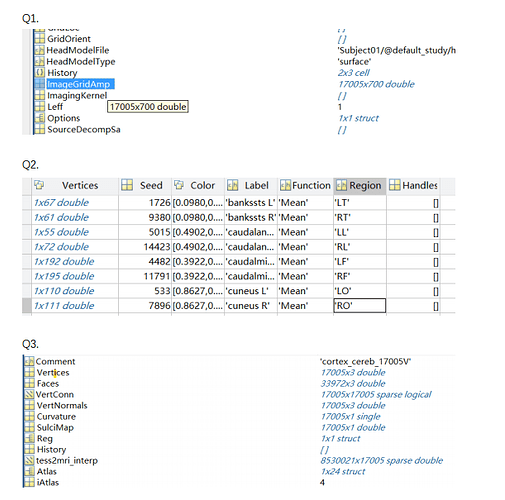
Q1. export the time series data of source analysis. i.e. "*.ImageGridAmp"
Q2. export the Desikan-Killiany scout files.
According the field of Vertices in scout files, we averaged the source data and transformed vertices-level data to ROIs-level (i.e. 17005x700 → 68x700)
Q3. export the cortex_cereb_17005V file, and extract the scs coordination of 68 seed use the field of Vertices, then transform scs to mni for visualization.
Another two question:
a.The source results are computed using averaged tasked-related ERP curves across trials. Can source results be calculated at trial level using BST and generate a file of 17005x700xtrials?
b.The final time series data of 68x700 for FC analysis.Does it calculate FC metrics (e.g. PLV) from different frequency bands and have interpretable physiological significance?
Thanks again.
Hi @dongke152
Right-click on the source file, then File > Export to Matlab
The simplest way would be to compute the Scout time series in Brainstorm. To do so, use the process Extract > Scout time series on the source file. This will create a matrix file of the shape [68x700], then export these time series as indicated in Q1.
Scouts are sets of vertices for the surfaces that contains them. With this said, the SCS coordinates for the ScoutA with a seed i is: surface.Vertices(i, :)
https://neuroimage.usc.edu/brainstorm/Tutorials/Scouts#On_the_hard_drive
Lastly, you can convert them from SCS to MNI with the function cs_convert:
https://neuroimage.usc.edu/brainstorm/CoordinateSystems#Converting_between_coordinate_systems
Yes you can compute sources per trials, but they will not be concatenated in the 3rd dimension in Brainstorm. You would need to export them in Matlab and concatenate them there.
Yes, you can use the resulting matrix (from Q2) to compute connectivity metrics. including PLV defined in canonical or custom frequency bands. Regarding the interpretation, please refer to the corresponding literature.
