I tried exporting the PSD struct to matlab. But, I couldn't find the power values in any of the elements of the power spectrum structure](https://neuroimage.usc.edu/brainstorm/Tutorials/ArtifactsFilter).
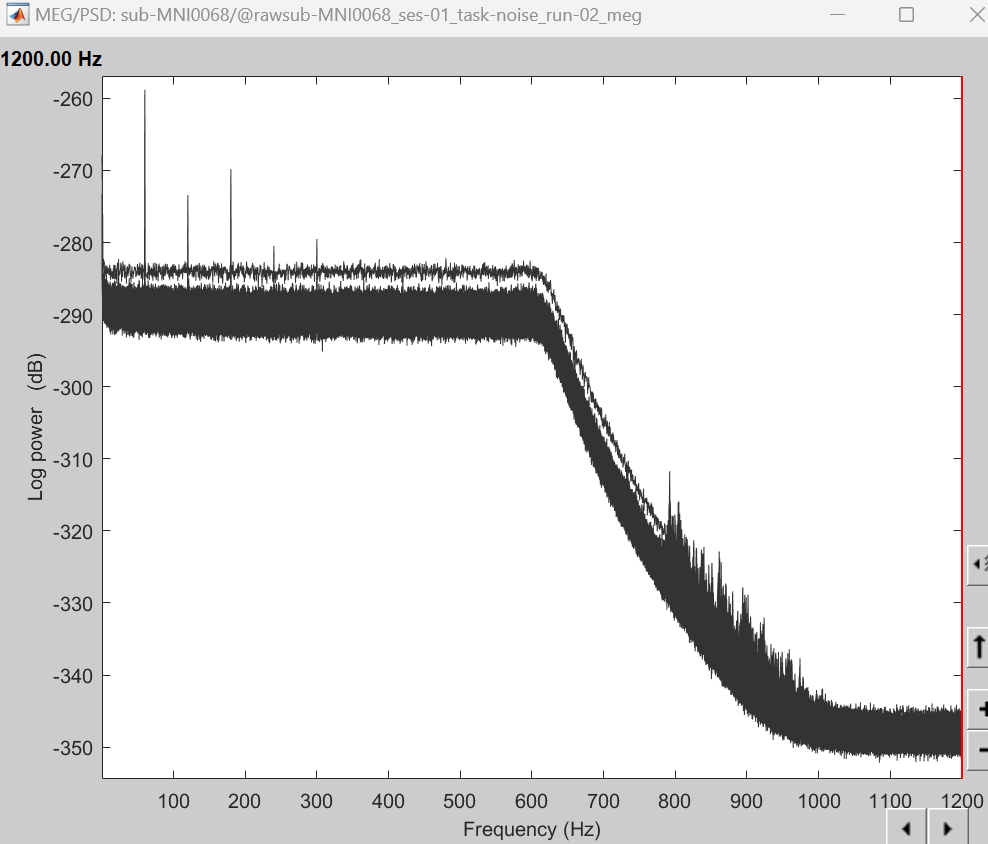
I want to access the power (ie. Y axis valyes of following graph) of each frequency.
Can someone help me here out?
Hi @Rasmita,
As indicated in the docs
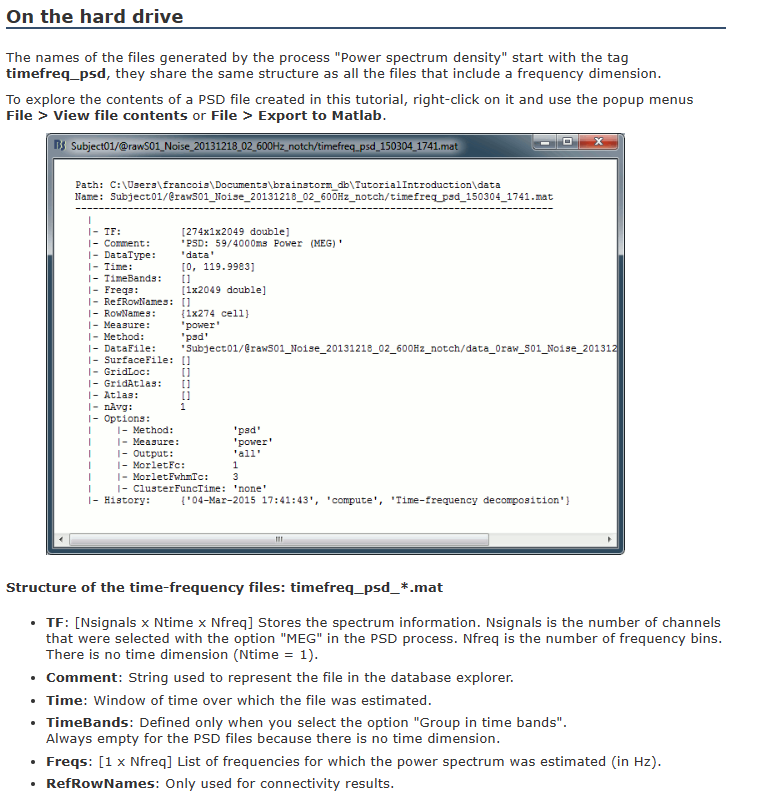
- PSD values are stored in the
TF field of the exported structure, it has the shape [Nchannels, NTime, Nfreqs]. As it's PSD Ntime is equal to 1.
- As the field
Measure indicates power, the PSD values are u^2/Hz
- The names of the channels are stored in the field
RowNames
- The frequency axis in the field
Freqs
With all this, the following lines replicate the figure:
% psd_data is the exported structure
figure()
plot(psd_data.Freqs, 10*log10(squeeze(psd_data.TF))' )
legend(psd_data.RowNames)