Dear Sir ,
I would like to compare two conditions' frequency relative values of 100 second resting state EEG data. I have ten subjects for each condition. I have done all the steps in tutorials/RestingOmega.
I would like to know how can I extract the PSD relative values . I couldn't understand the Maltab extracted file .
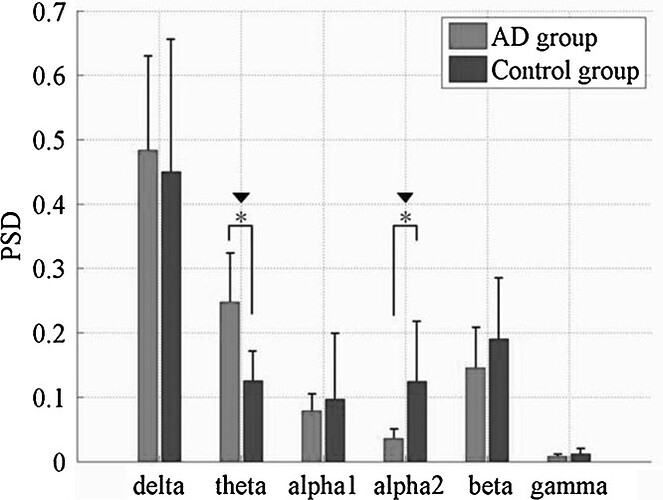
I need values for making the following chart:
Your Faithfully
First, you need to group the PSD values in frequency bands, if you have computed the full spectrum: process Frequency > Group in time or frequency bands.
To compare the values for the two condition, you probably want to use a non-parameteric test:
https://neuroimage.usc.edu/brainstorm/Tutorials/Statistics
I would like to know how can I extract the PSD relative values . I couldn't understand the Maltab extracted file .
The Brainstorm data structures are all documented in the introduction tutorials, in the sections "On the hard drive":
https://neuroimage.usc.edu/brainstorm/Tutorials/ArtifactsFilter#On_the_hard_drive
https://neuroimage.usc.edu/brainstorm/Tutorials/Scripting#File_structures
1 Like
